Leaf disease classifiers are well studied; the hard part in practice is the data. Public sugarcane datasets are scattered across platforms, labelled with different class names, and, as it turned out, partially copies of each other.
- Client
- Turing Agro product line - requested by a sugarcane mill group and an agriscience R&D team
- Industry
- Agriculture · Sugar & ethanol
- Problem
- A scout in the field has a phone, not a lab. The question "is this leaf sick, and with what?" needed an answer at the point of capture
- Solution
- A two-stage image classifier: healthy versus unhealthy first, then disease type (red rot, rust, bacterial spots, dry leaves, yellow leaf syndrome, among others), trained on a curated merge of six public datasets after duplicate removal
- Stack
- Six public sugarcane leaf datasets (Roboflow, Kaggle/Mendeley, GitHub) · MD5 duplicate detection · class-balance analysis · CNN image classification · top-1 / top-5 accuracy tracking · held-out test set
- Result
- Top-1 accuracy 0.991 on training; normalized test confusion matrix with 0.96–0.98 diagonal on healthy vs unhealthy
Leaf disease classifiers are well studied; the hard part in practice is the data. Public sugarcane datasets are scattered across platforms, labelled with different class names, and, as it turned out, partially copies of each other. Train on the naive union and you test on your training images without knowing it.
- A model that works on ordinary smartphone photos of leaves
- A first, reliable healthy/unhealthy decision
- A second decision naming the disease
- A dataset assembled with enough care that the reported accuracy means something
- Deduplicated, merged training set with documented provenance
- Class distribution analysed before training
- Healthy vs. unhealthy classifier with a clean held-out test
- Disease-type classifier as the second stage
- 01
Assembling the data
Six sources were collected: a Roboflow augmented set with 200+ classes, a Mendeley set of ~20,000 images via Kaggle, a 2025 Mendeley article dataset, a Roboflow sugarcane disease detection set, a GitHub sugarcane leaf disease set, and a Mendeley sugarcane leaf image dataset.
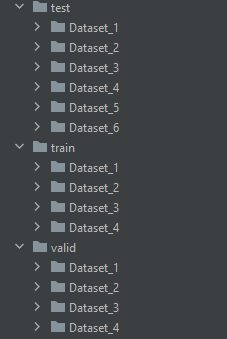
Fig. 01. Six datasets, six folder conventions, six label vocabularies. - 02
The duplicate trap
Every image was hashed with MD5: identical content produces an identical 32-character signature. The check found that dataset 3 and dataset 6, published under different links, contained the same images. Dataset 6 was dropped.
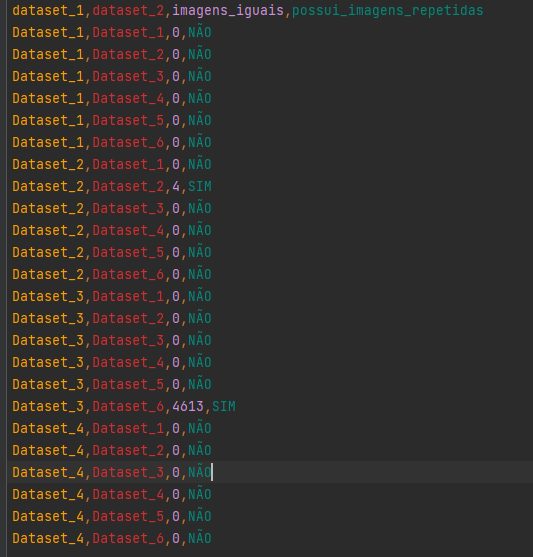
Fig. 02. Hashing every file. Matching hashes across folders are the leak. 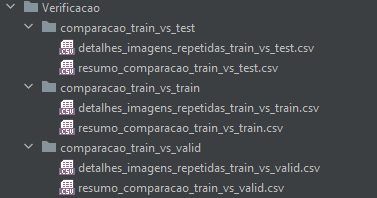
Fig. 03. The same photos under two different dataset names. Without this step the test set would have overlapped the training set. - 03
Class balance
Distributions were plotted per dataset and after merging. The merged set is heavily skewed toward unhealthy leaves, which shapes how the two-stage design and the evaluation were set up.
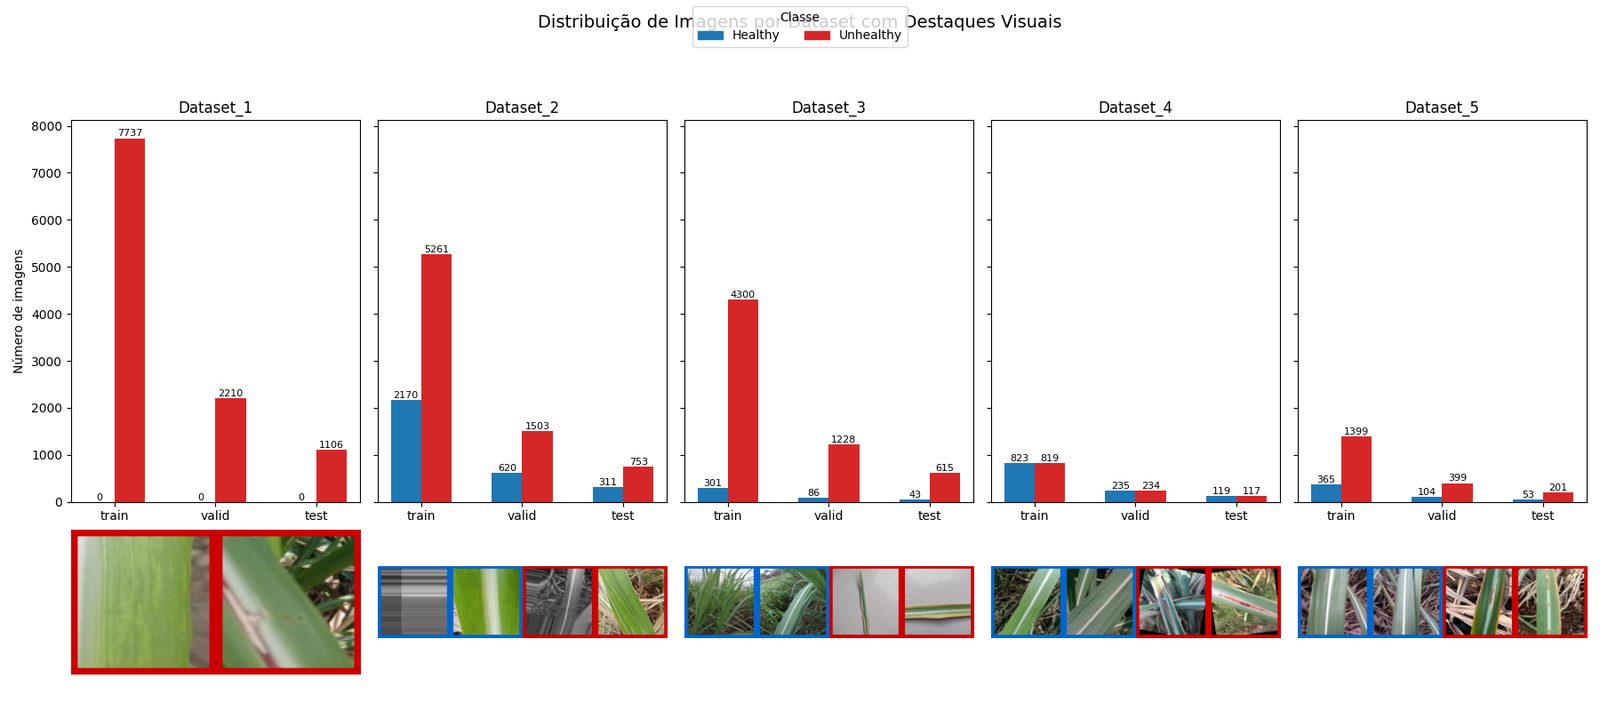
Fig. 04. Per dataset: healthy in blue, unhealthy in red, with sample images. Some sources have almost no healthy leaves. 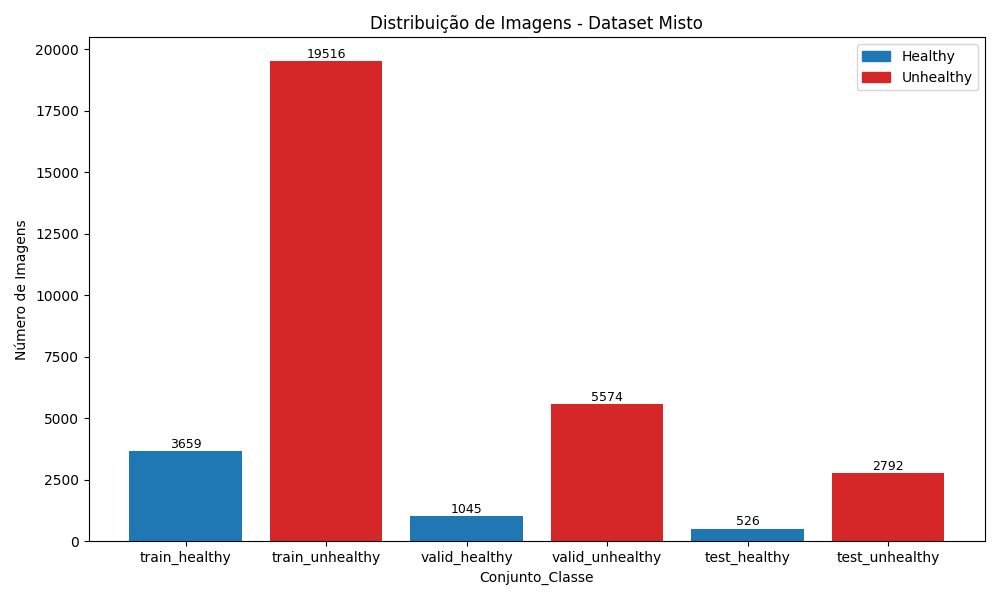
Fig. 05. Merged: the imbalance is explicit before the first epoch. - 04
Training
Stage one, healthy versus unhealthy, was trained to completion with top-1 and top-5 accuracy tracked per epoch.

Fig. 06. Final training epoch: top-1 accuracy 0.991. 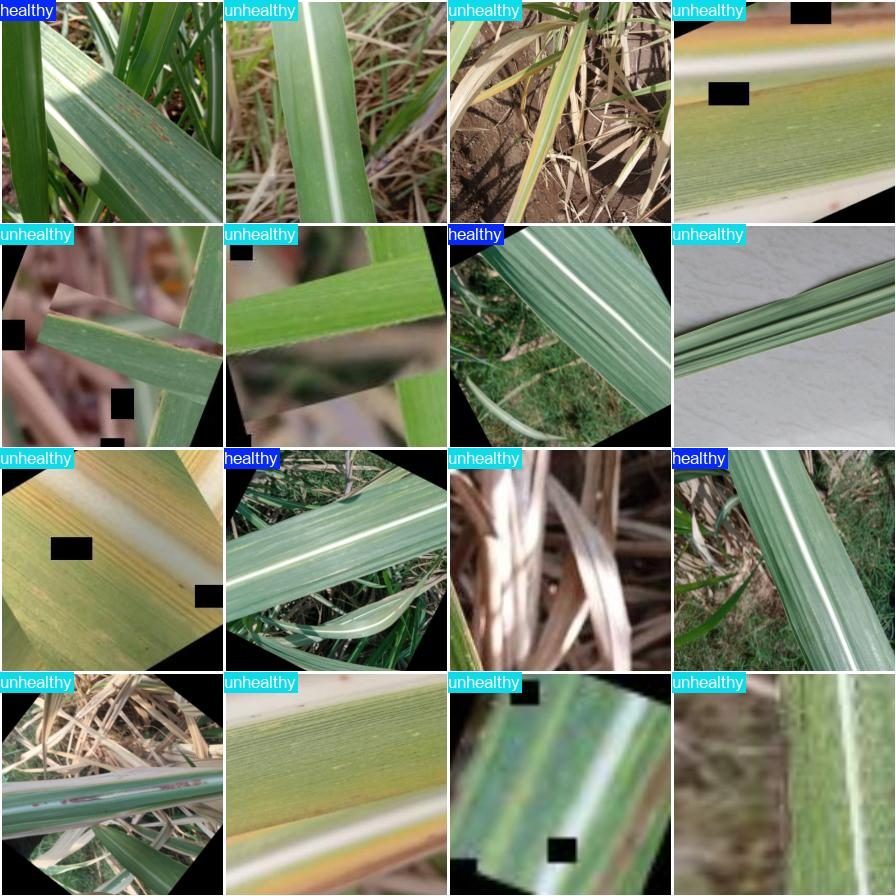
Fig. 07. A healthy batch as the model saw it: field backgrounds, varied lighting, phone framing. 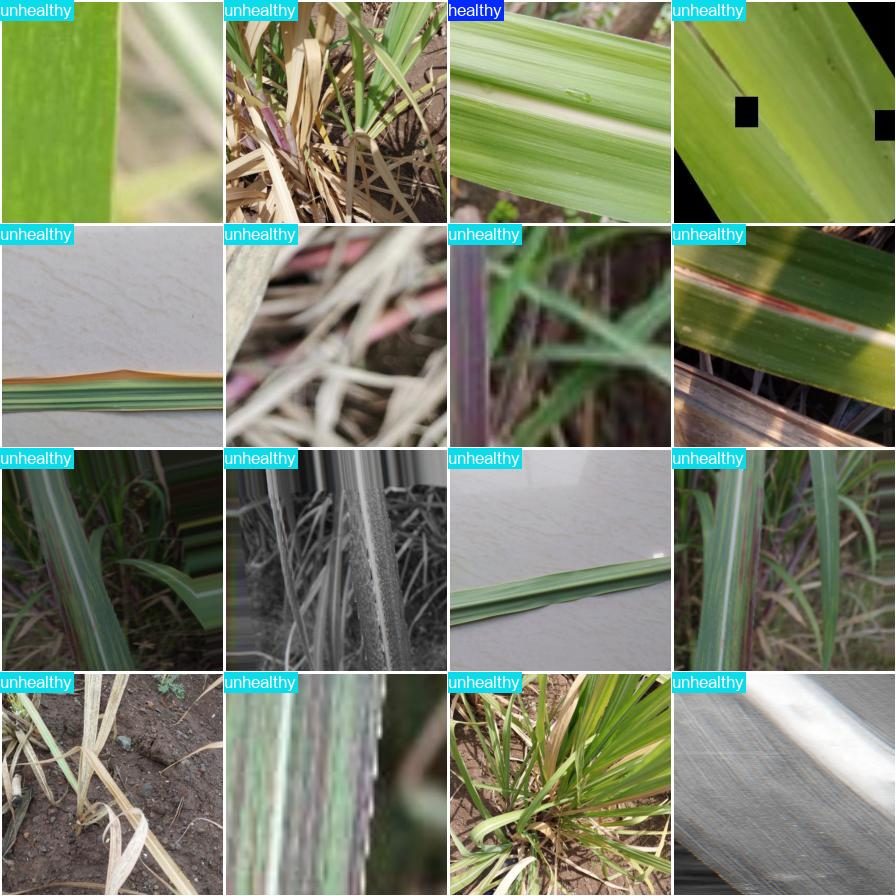
Fig. 08. An unhealthy batch. Lesions, rust and drying at the resolution a phone provides. 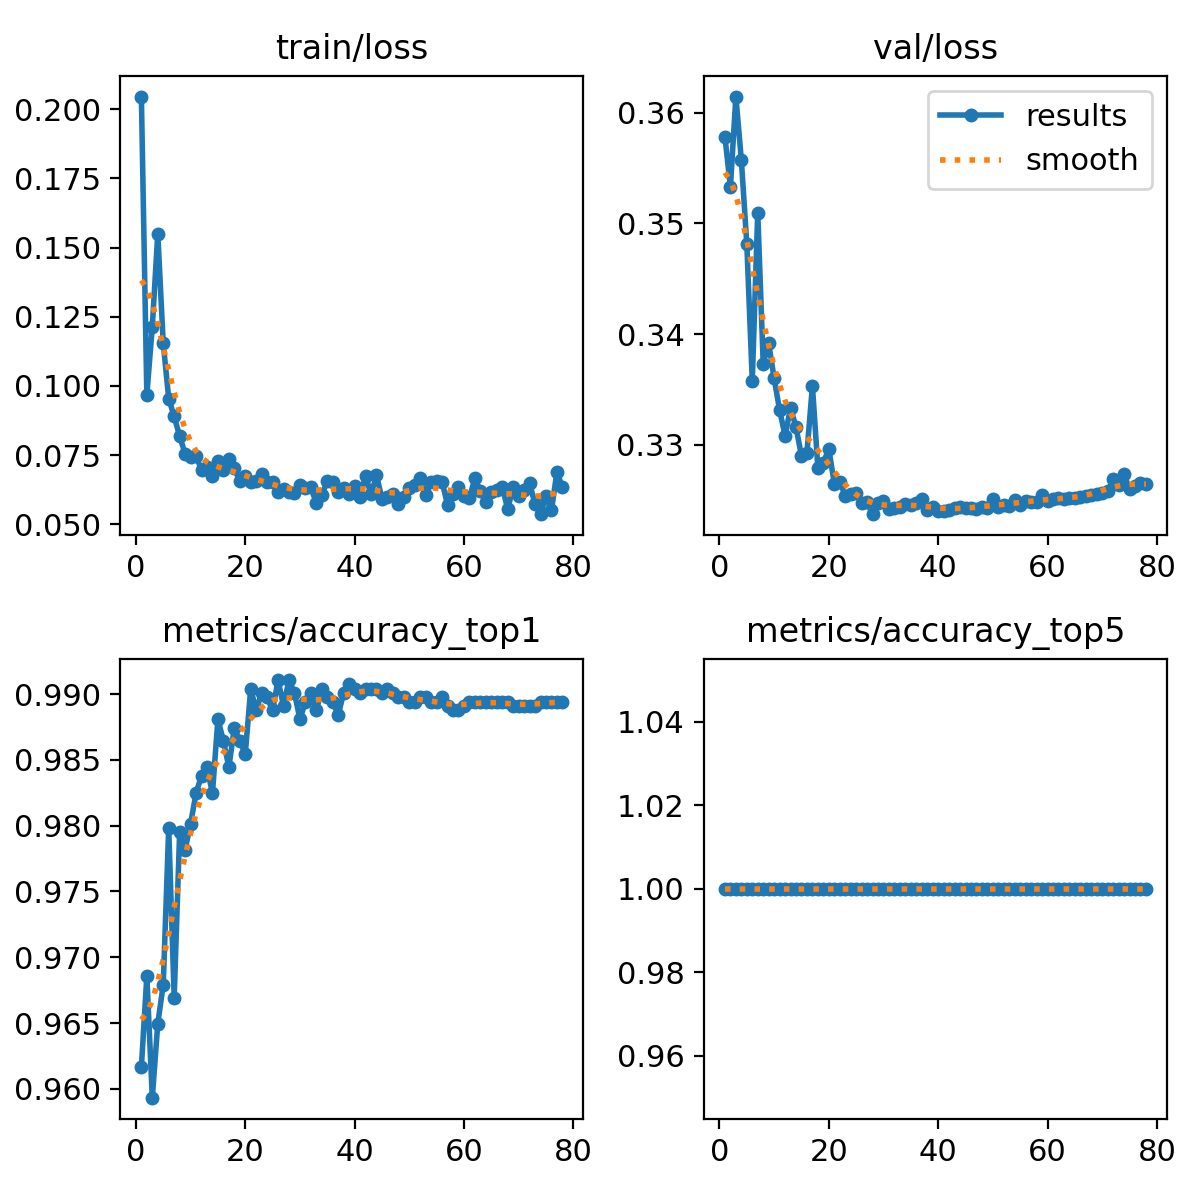
Fig. 09. Train and validation loss, top-1 and top-5 accuracy. Converged without the validation curve diverging. - 05
Test
Held-out test, normalized: 0.98 of healthy leaves and 0.96 of unhealthy leaves classified correctly. The second stage then names the disease: red rot, rust, bacterial spots, dry leaves, yellow leaf syndrome, and others.
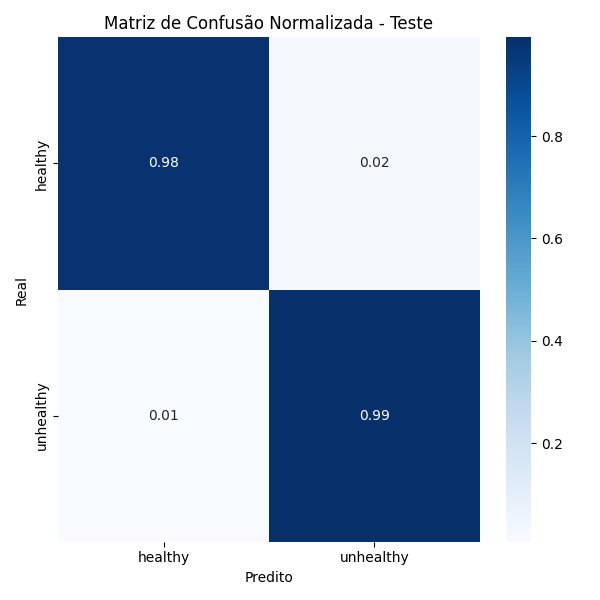
Fig. 10. Held-out test, normalized: 0.98 of healthy leaves and 0.96 of unhealthy leaves classified correctly. The second stage then names the disease: red rot, rust, bacterial spots, dry leaves, yellow leaf syndrome, and others.
- Hashing before training, which removed a cross-dataset leak that would have inflated every number
- Plotting class balance before choosing a design
- A two-stage decision, so the frequent question (sick or not?) gets the most data
- Keeping a held-out test whose images were verified not to appear in training