Two counting problems with the same shape. At the silo, a sample of grains is graded for damage and foreign material (clods of soil, fragments of wood).
- Client
- Turing Agro product line - grain quality and yield-component estimation
- Industry
- Agriculture · Grains
- Problem
- Grain grading and pod counting are done by eye and by sample; the results are slow, subjective, and impossible to audit
- Solution
- Two object detectors trained from public datasets: a four-class grain detector (good, damaged, clod, wood) and a single-class pod detector, evaluated with per-class precision/recall, mAP and confusion matrices on verified non-overlapping test sets
- Stack
- Roboflow datasets (7,768 grain images; 2,689 pod images) · YOLO-family object detection · best/last checkpoint comparison · per-class metrics · normalized confusion matrices · augmented dataset expansion (~20k grains, ~7k pods)
- Result
- Grains: mAP50 0.912, F1 0.844. Pods: mAP50 0.907, F1 0.849
Two counting problems with the same shape. At the silo, a sample of grains is graded for damage and foreign material (clods of soil, fragments of wood). In the field, pods per plant are a yield component estimated by counting. Both are repetitive, both are done by people with other things to do, and both produce numbers nobody can re-check afterward.
- A grain detector that separates good grain from damaged grain and from the two common contaminants
- A pod detector that finds every pod on a photographed plant
- Metrics per class, not a single accuracy number
- Test sets guaranteed disjoint from training
- Four-class grain model with per-class precision and recall
- Single-class pod model with mAP50 above 0.9
- Confusion matrices on held-out photos
- A plan to scale training to the augmented datasets
- 01
Grains: four classes, 7,768 images
The dataset labels each grain as good, damaged, clod, or wood. Training was run to 185 epochs (15.6 h); the best checkpoint landed at epoch 84 (4.91 h). Checkpoint - Epochs - Time - Precision - Recall - F1 - mAP50 - mAP50-95; Best - 84 - 4.91 h - 0.836 - 0.836 - 0.844 - 0.912 - 0.781; Last - 185 - 15.6 h - 0.855 - 0.829 - 0.842 - 0.904 - 0.776
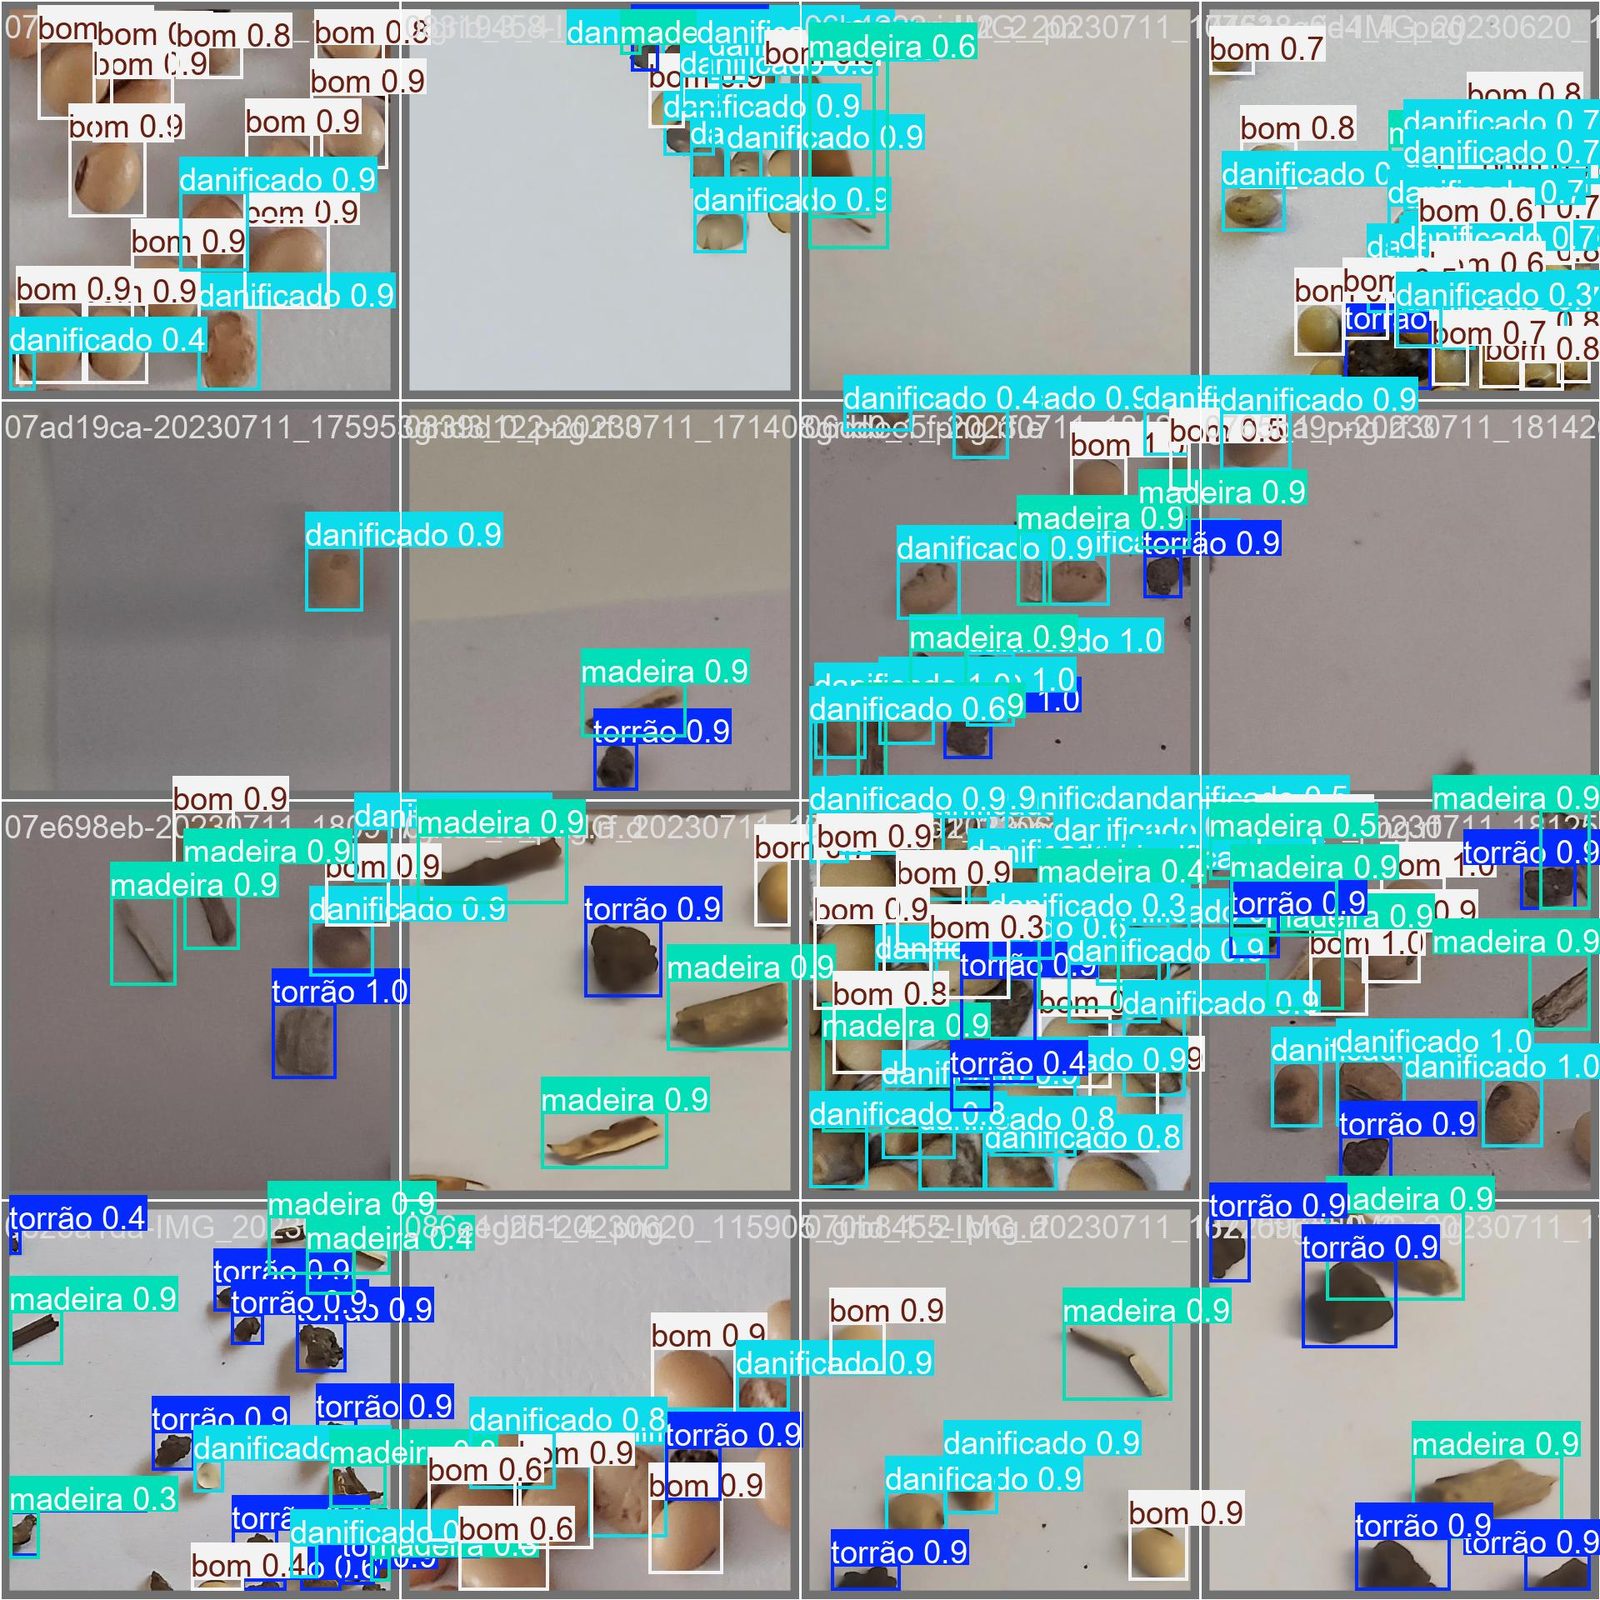
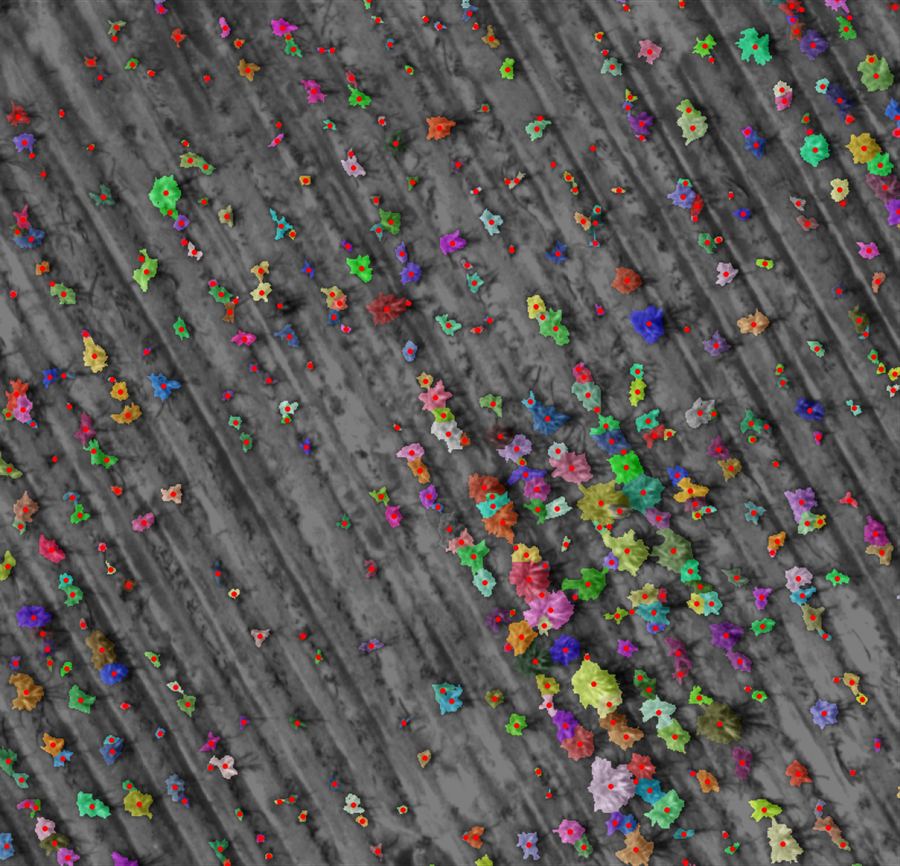
Fig. 01. Training mosaic: every grain boxed and classed. Dense, overlapping, and small, which is what makes it a detection task rather than a classification one. 
Fig. 02. Per-class metrics. The contaminant classes are rarer and the numbers say so. 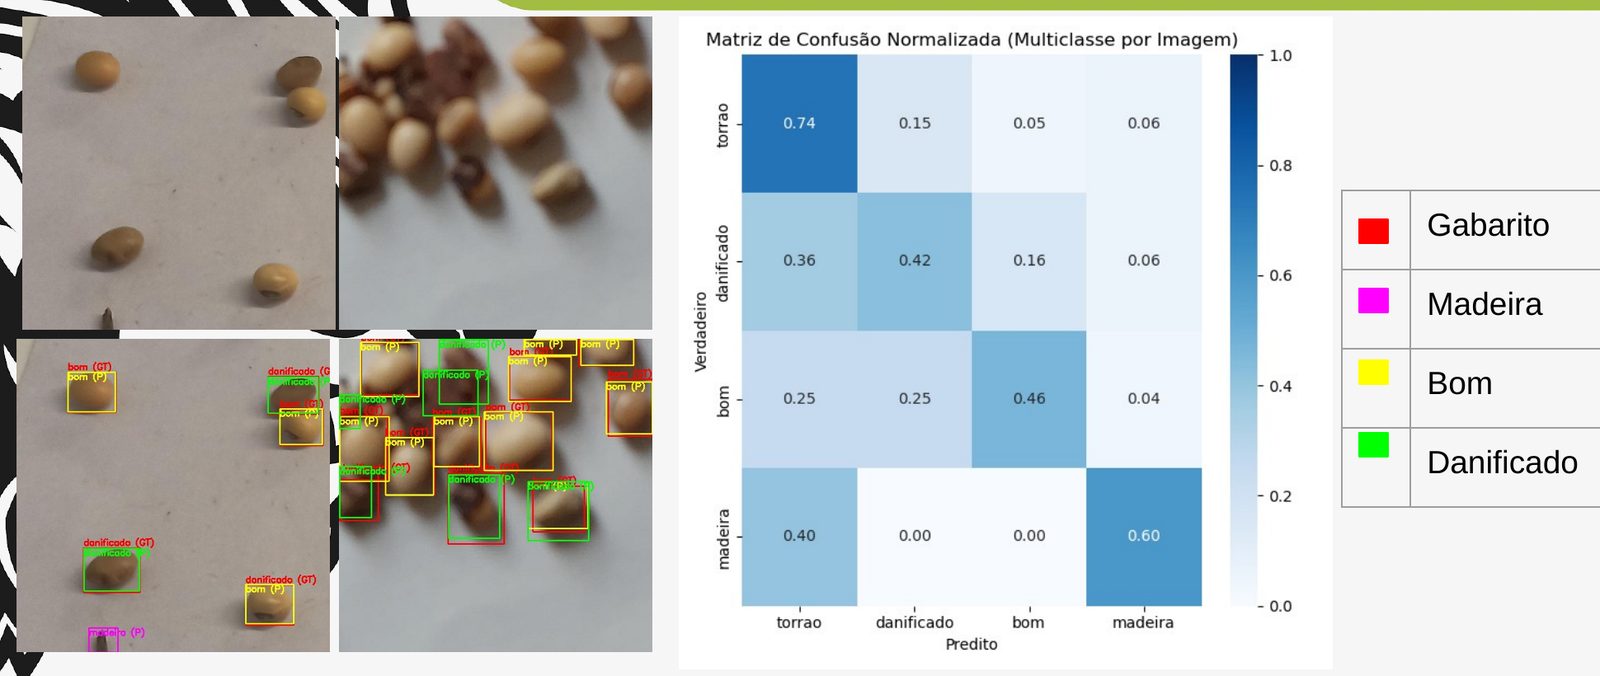
Fig. 03. Test photos with detections. Legend: ground truth, wood, good, damaged. 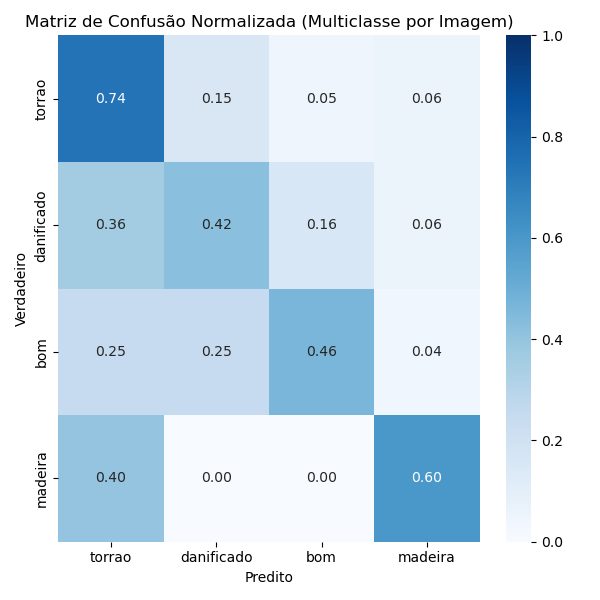
Fig. 04. Normalized confusion matrix on the test set. Most confusion is between damaged and good, which is also where human graders disagree. - 02
Pods: one class, 2,689 images
The pod dataset has a single class. Training ran 154 epochs (2.54 h); best checkpoint at epoch 104 (1.16 h). It was verified that no test image appears in the training directory. Checkpoint - Epochs - Time - Precision - Recall - F1 - mAP50 - mAP50-95; Best - 104 - 1.16 h - 0.866 - 0.832 - 0.849 - 0.907 - 0.613; Last - 154 - 2.54 h - 0.879 - 0.823 - 0.850 - 0.899 - 0.605
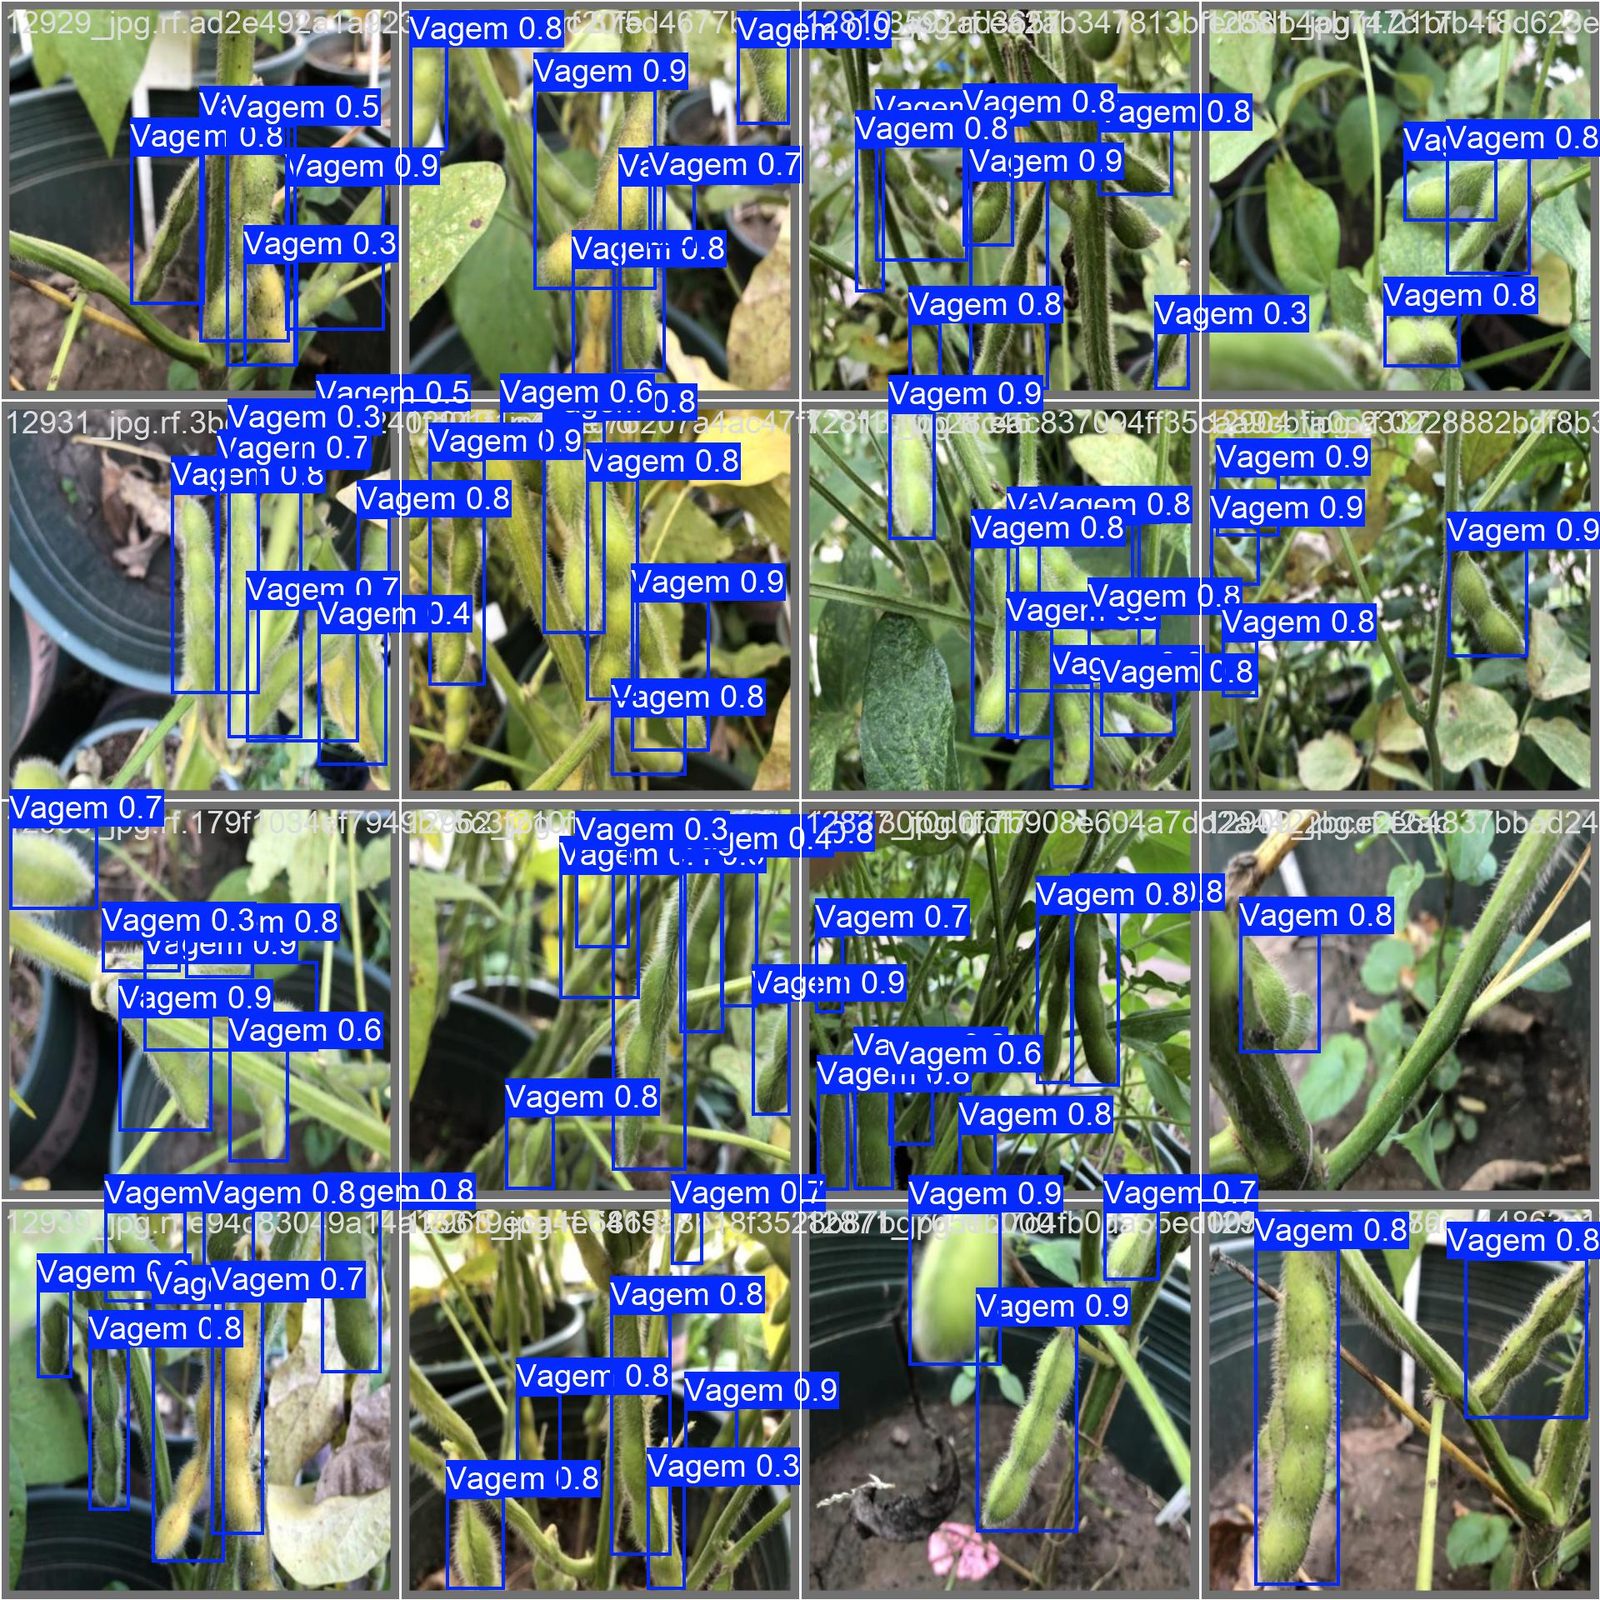
Fig. 05. Pod training mosaic. Pods overlap, hide behind leaves, and vary in orientation. 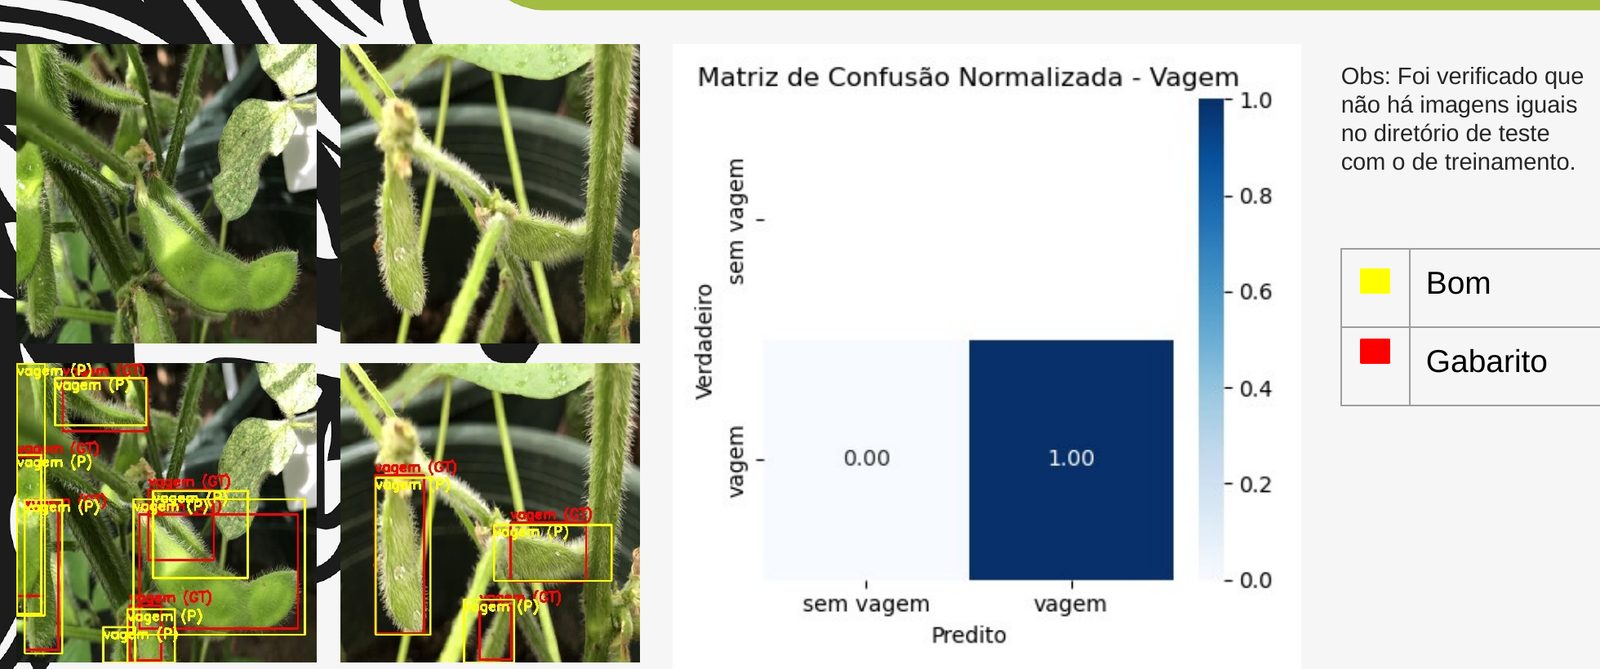
Fig. 06. Test photos with detected pods. The lower mAP50-95 reflects loose box fit on occluded pods, not missed pods. 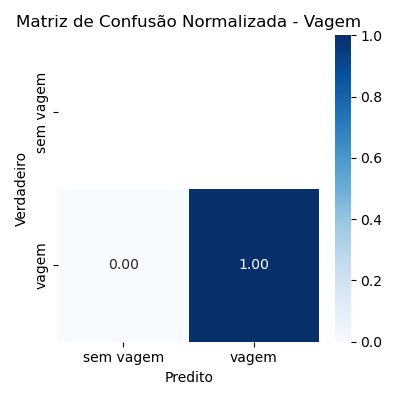
Fig. 07. Confusion matrix on the test set. Pods are found; background is not mistaken for pods. - 03
Next step
Both models are being retrained on the augmented versions of the datasets: roughly 20,000 grain images and 7,000 pod images.
- Best versus last checkpoint compared explicitly, so the shipped model is not just the longest-trained one
- Per-class metrics and confusion matrices instead of a headline accuracy
- Test/train overlap verified before reporting
- Two problems with the same shape handled with the same pipeline