A sugarcane harvest front is a convoy. A harvester cuts, a transbordo (an infield haul-out wagon pulled by a tractor) collects the cane beside it, drives to the field edge, and dumps into a road truck.
- Client
- Ipiranga Agroindustrial - sugarcane group running four mills in São Paulo and Minas Gerais (Descalvado, Mococa, Iacanga, Passos)
- Industry
- Agriculture · Sugar & ethanol
- Problem
- Infield haul-out units (transbordos) were idle most of the day and nobody could say exactly why, or where
- Solution
- Minute-level telemetry analysis of the whole transbordo fleet: productive time, stop reasons, truck-shortage hotspots, speed zones, and an economic case for smart truck dispatch
- Stack
- Georeferenced equipment monitoring (1 row / minute) · Python data pipeline · usage heatmaps · stop-reason attribution · geospatial speed zoning · mill intake reconciliation
- Delivered as
- MVP report + decision model, April 2025
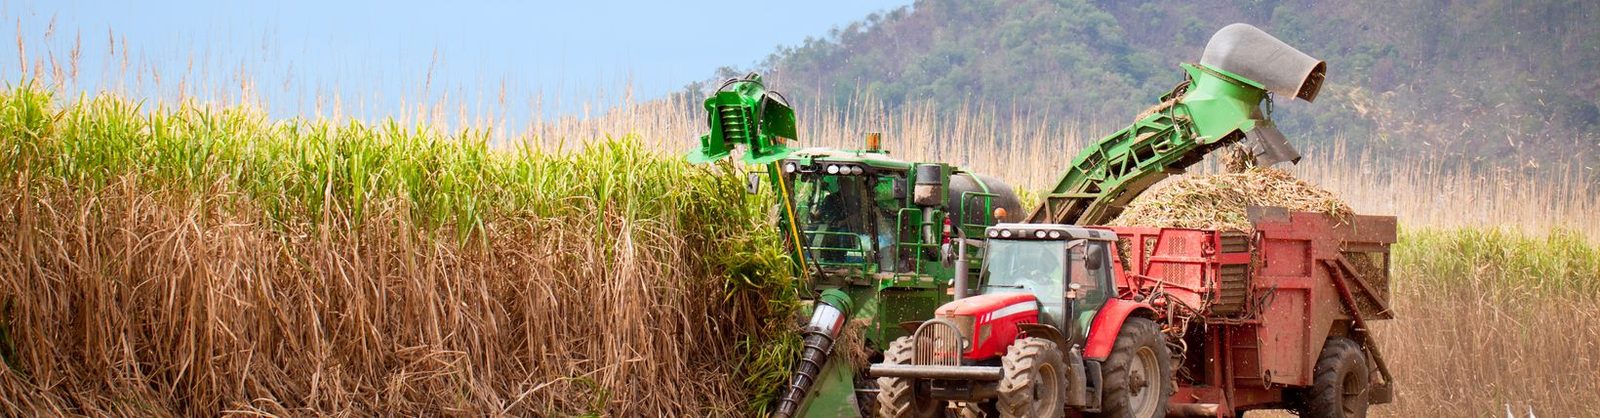
A sugarcane harvest front is a convoy. A harvester cuts, a transbordo (an infield haul-out wagon pulled by a tractor) collects the cane beside it, drives to the field edge, and dumps into a road truck. If the truck is not there, the transbordo waits. If the transbordo waits, the harvester stops. The mill sees only the tons that arrive.
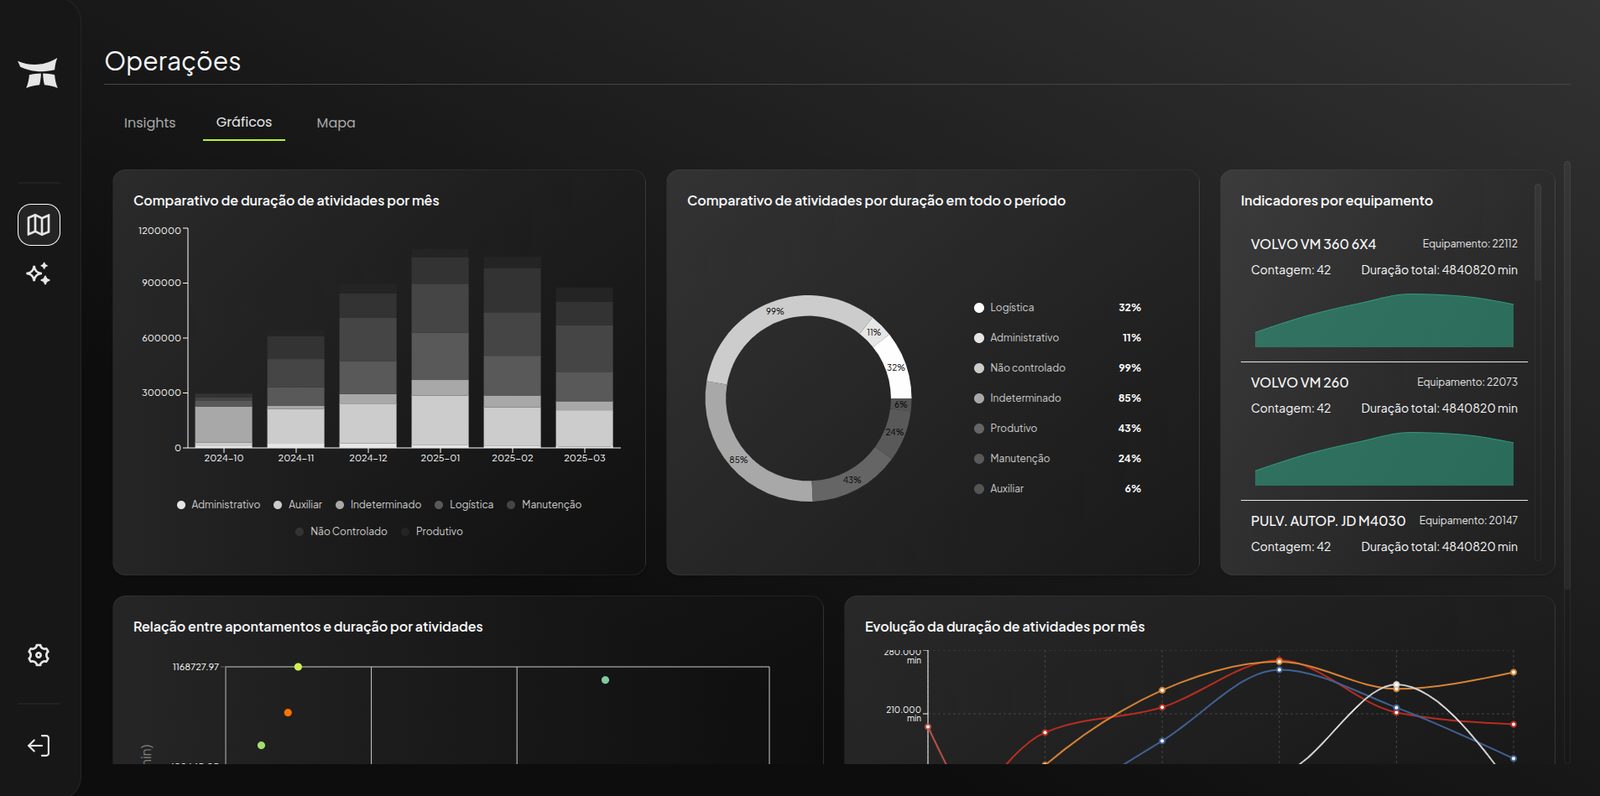
Ipiranga had monitoring data - every transbordo reporting position and status roughly once a minute - but the data lived in a telemetry vendor's screens, not in a decision. The group knew idle time was high. It did not know the share, the reasons, the units, or the money.
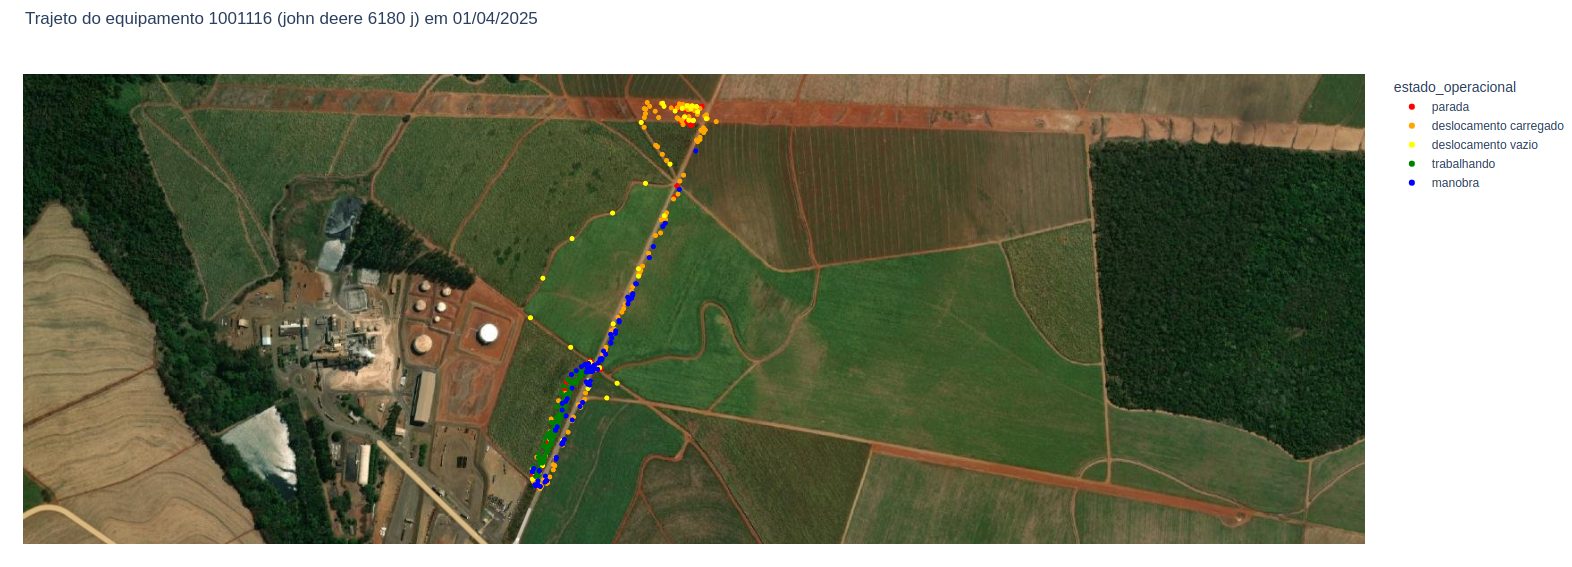
- Productive versus idle time for every transbordo, by mill, from raw telemetry
- Stop reasons ranked by hours lost, not by count of events
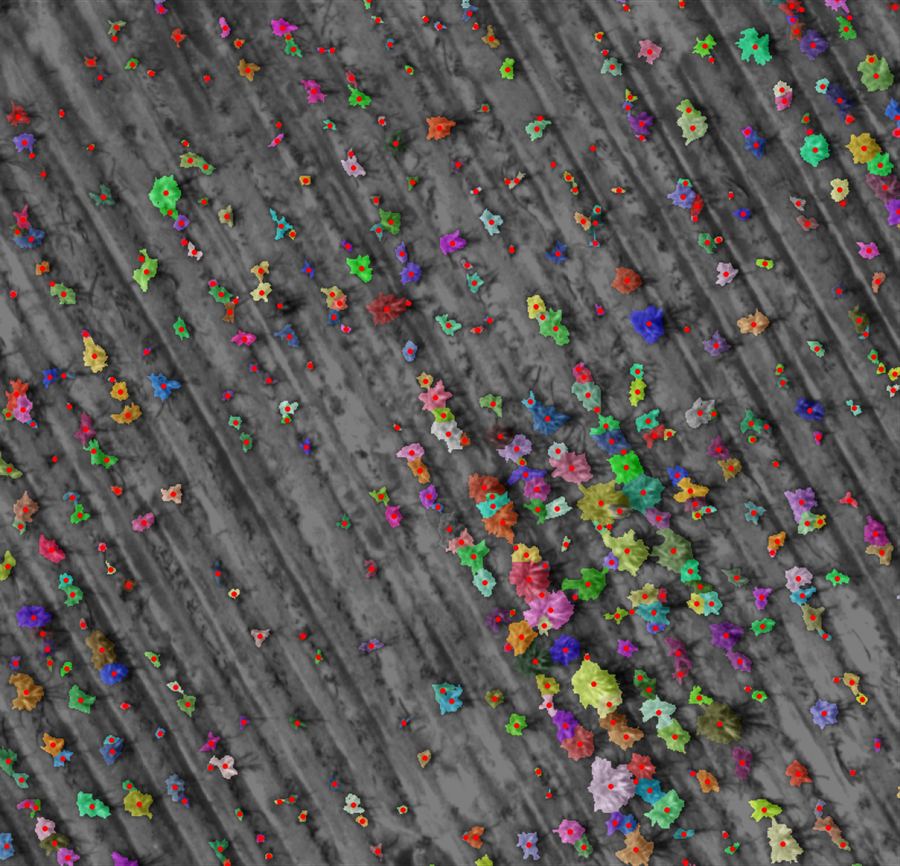
- Where and when trucks were missing, on a map, not in a table
- Something a logistics manager could act on before the next shift
- A defensible number for what dispatch optimization is worth per season
The window was nine days of full-fleet monitoring, 1–9 April 2025, mid-harvest at three of the four mills.
- Measured productive share of transbordo time, per unit
- Ranked stop reasons with hours attributed to each
- Truck-shortage hotspots geolocated for Iacanga (the unit with the worst idle share)
- Economic case for intelligent truck dispatch, in tons and BRL per season
- 01
Usage heatmaps
Every equipment-minute was tagged with its operational state and rolled into a day × equipment grid. The heatmap makes the fleet legible at a glance: which machines worked, when, and which ones were parked for whole days.
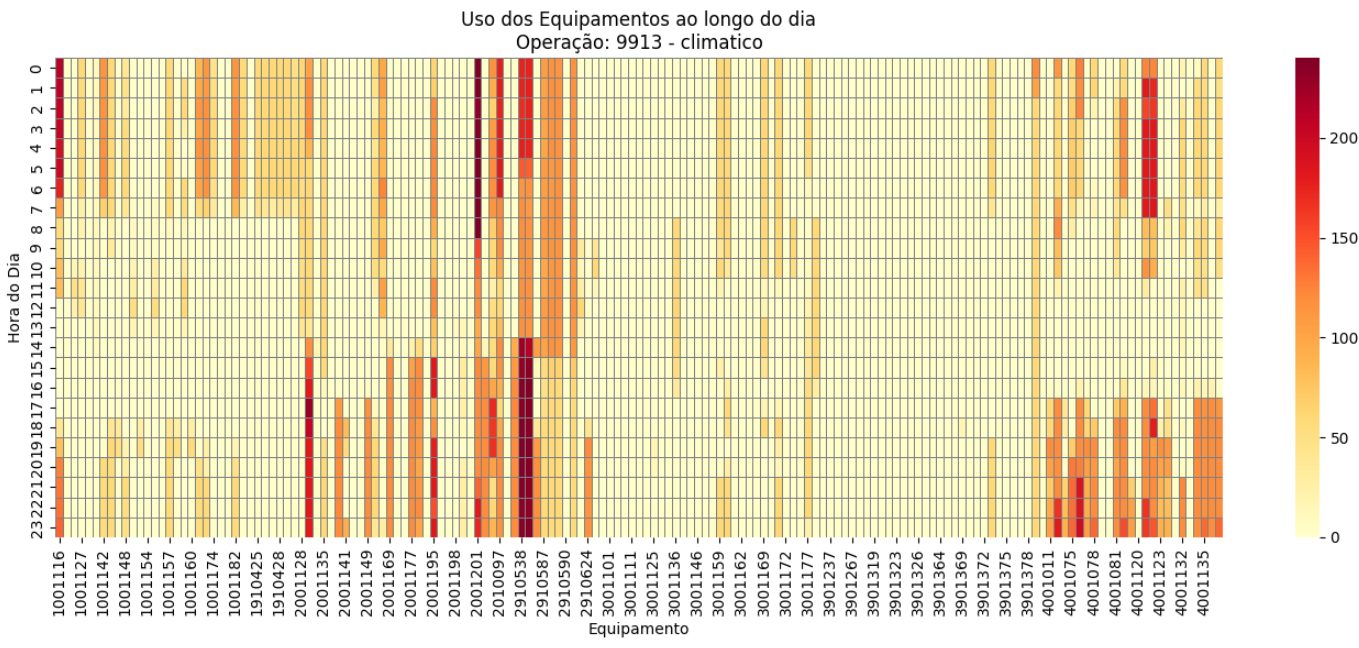
Fig. 03. All monitored equipment, nine days. Red is a machine that worked a full shift. Pale rows are machines that barely moved. 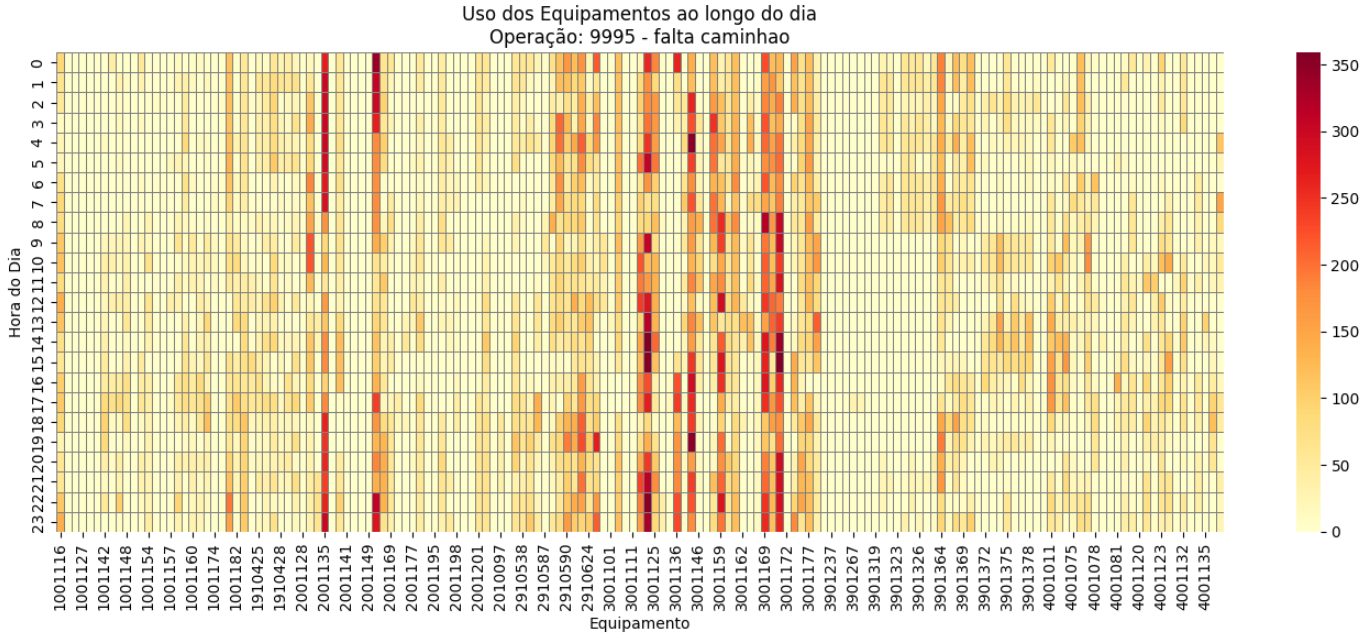
Fig. 04. Harvesters only. The cut is steady; the bottleneck is not here. 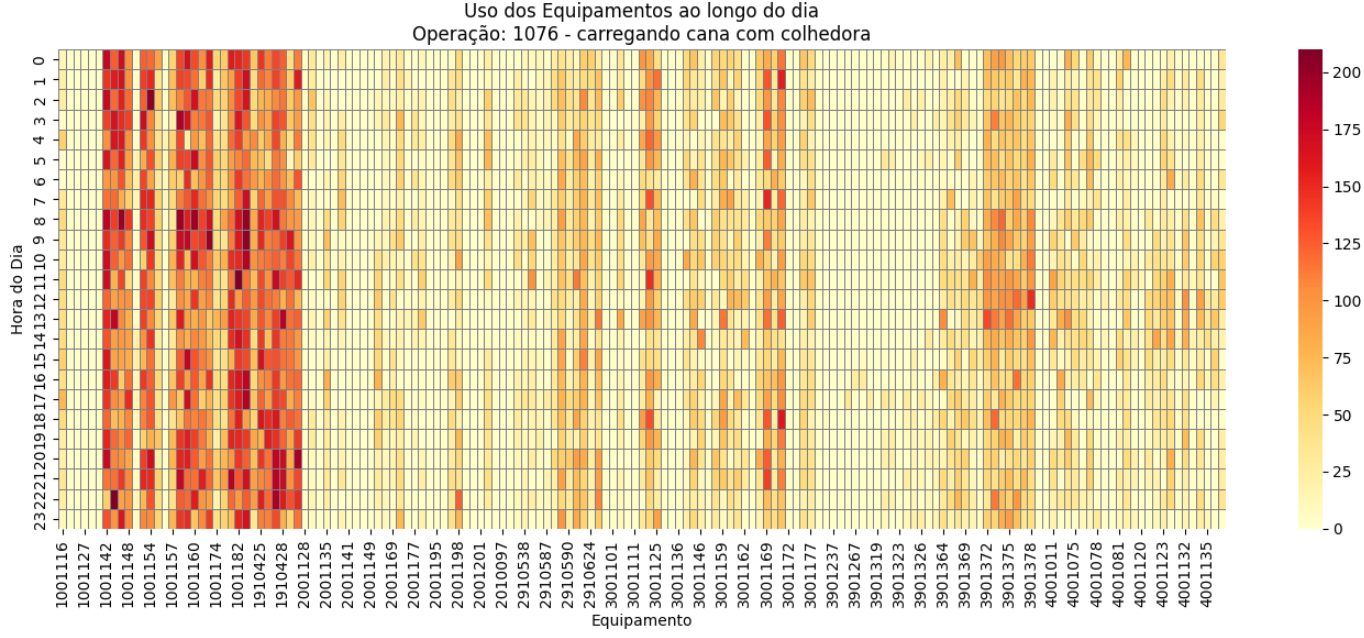
Fig. 05. Transbordos only. Same days, same fronts, far more empty space. The waiting is on this layer. - 02
Productive vs. idle
Across all Ipiranga units, transbordos were productive 34% of the observed time. The remaining 66% was split into named stop reasons from the telemetry event codes.
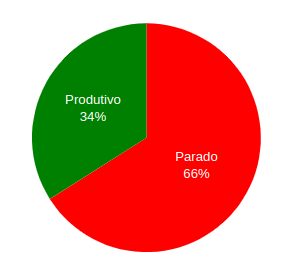
Fig. 06. The headline number. One third of the fleet's clock was moving cane. 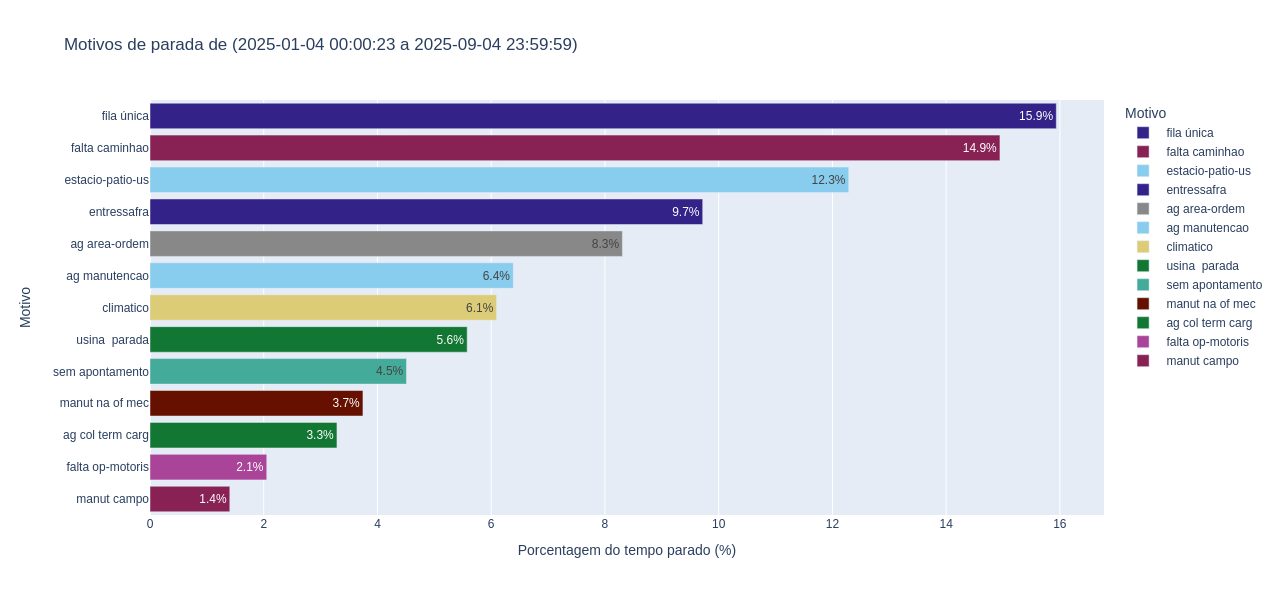
Fig. 07. Where the other two thirds went. Three reasons dominate: single queue at the field edge, no truck available, and parked in the mill yard. - 03
Per-mill breakdown
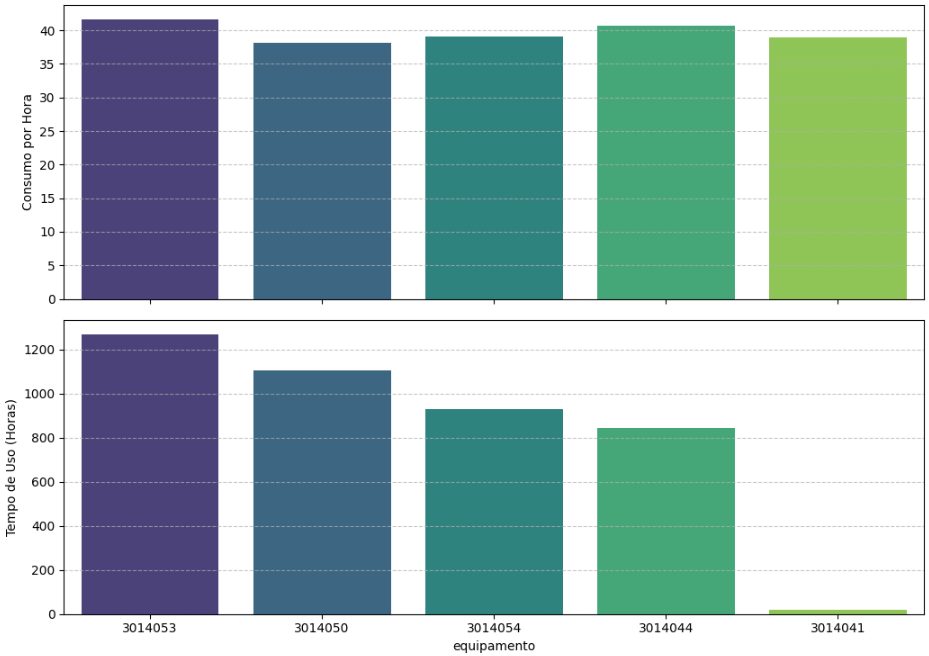
The group average hides the decision. Broken out by unit, Descalvado ran with fewer truck-shortage stops and delivered the most cane. Mococa and Iacanga, with more equipment and more operators, produced close to half of Descalvado's tonnage, with "no truck" as the top stop reason. Passos was in its off-season.
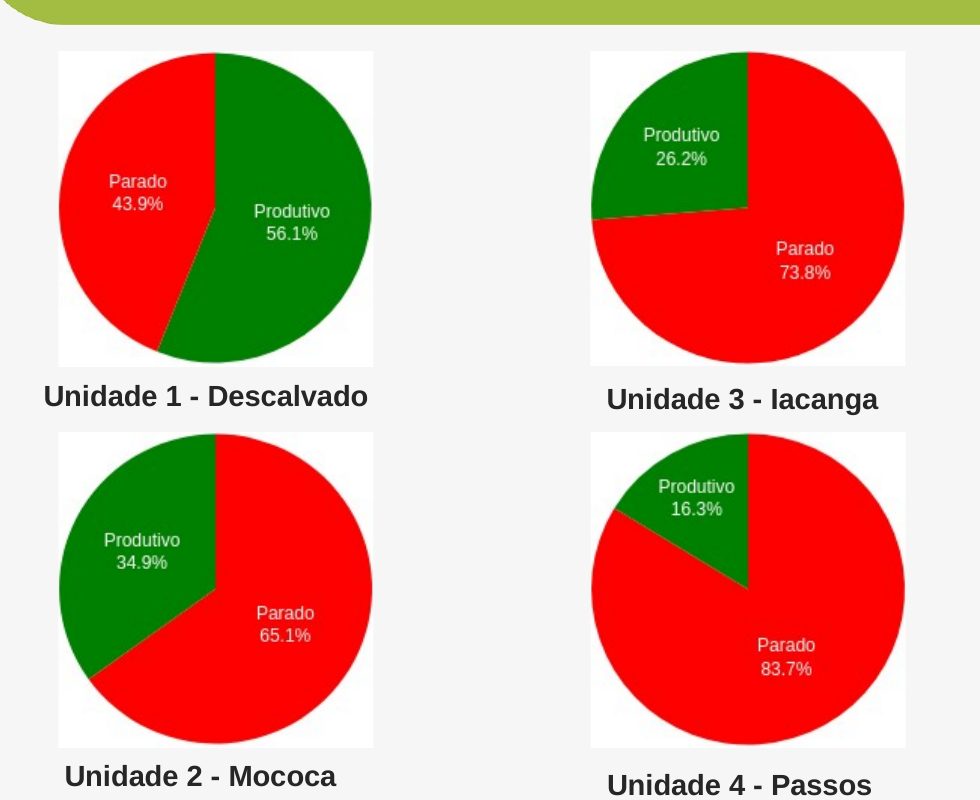
Fig. 08. Productive share per mill. Same telemetry, four different operations. 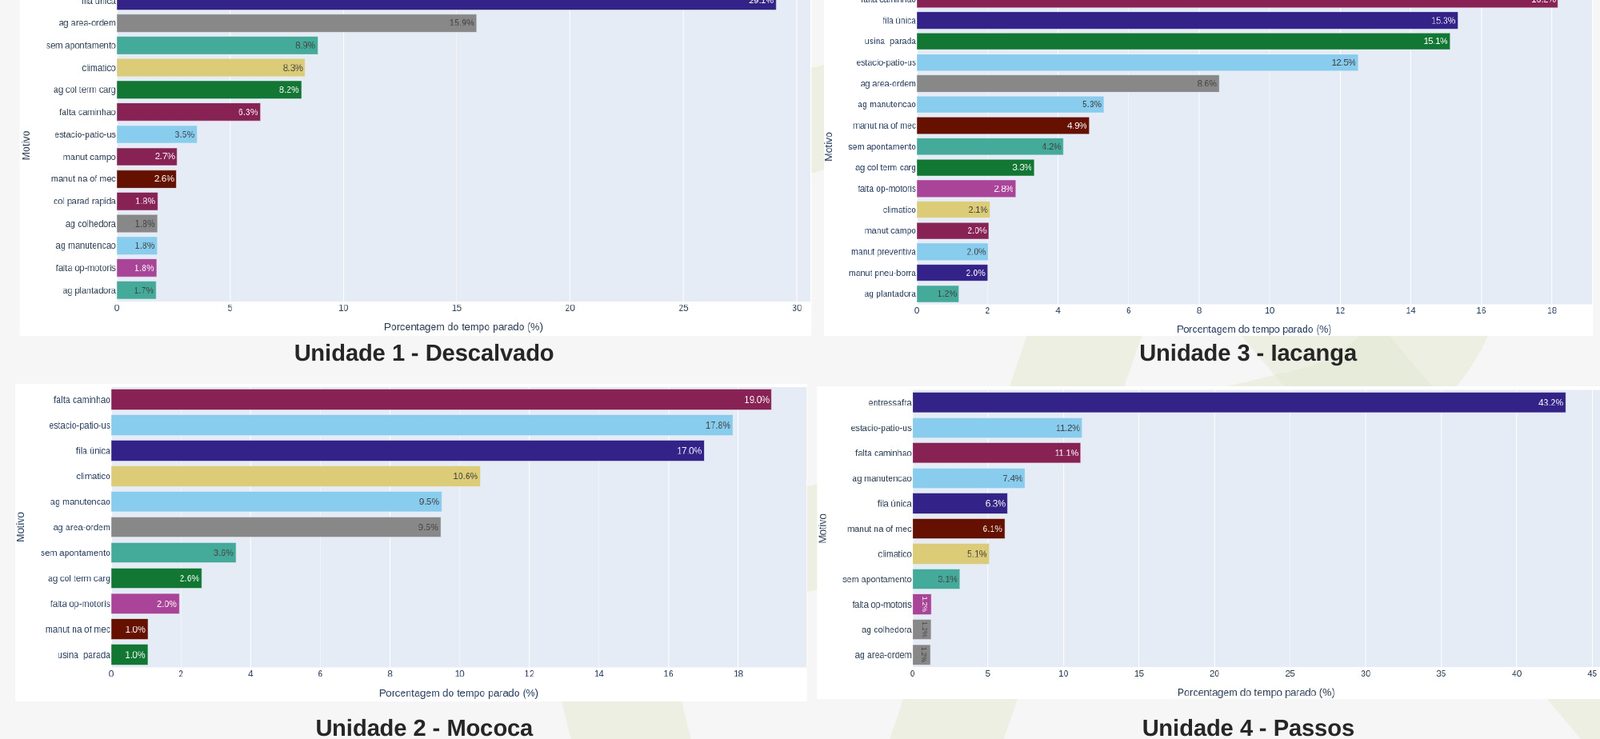
Fig. 09. Stop reasons per mill. Descalvado's queue problem is not Iacanga's truck problem, and the fixes are different. 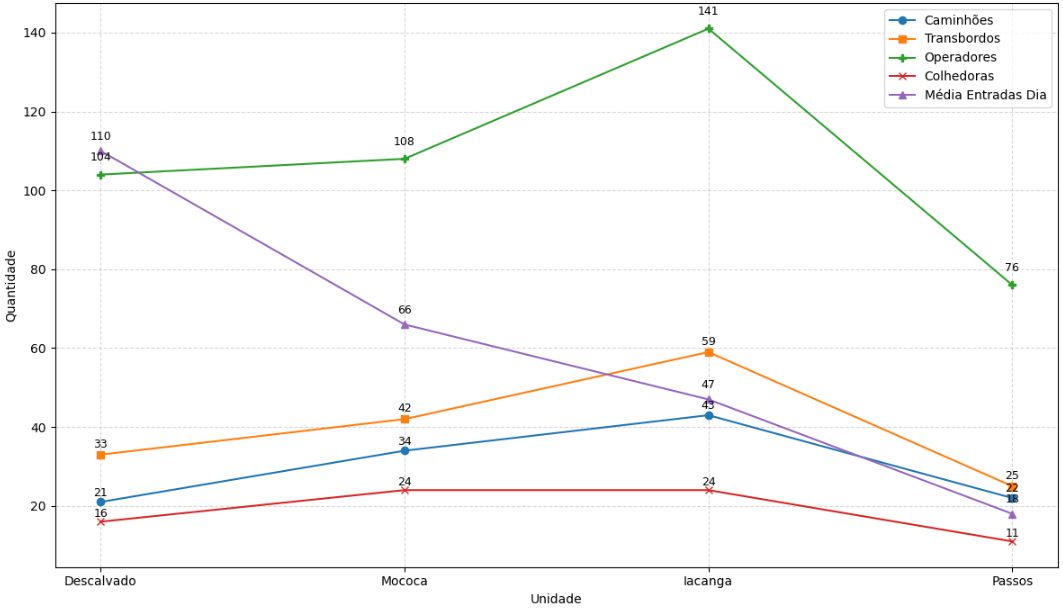
Fig. 10. Equipment and operators on the ground per unit. Mococa and Iacanga had more of both. 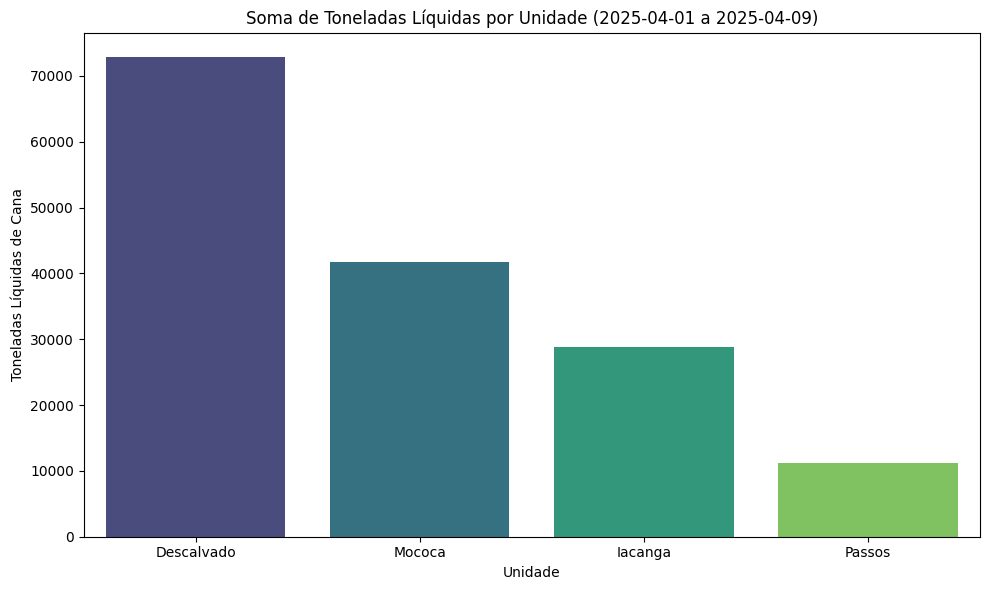
Fig. 11. Tons delivered per mill in the same nine days. More machines, less cane: the constraint is downstream of the harvester. - 04
Iacanga, on a map
Iacanga had the highest idle share, so it became the worked example. Stop reasons were ranked, then every minute tagged "no truck" was plotted on the property map.
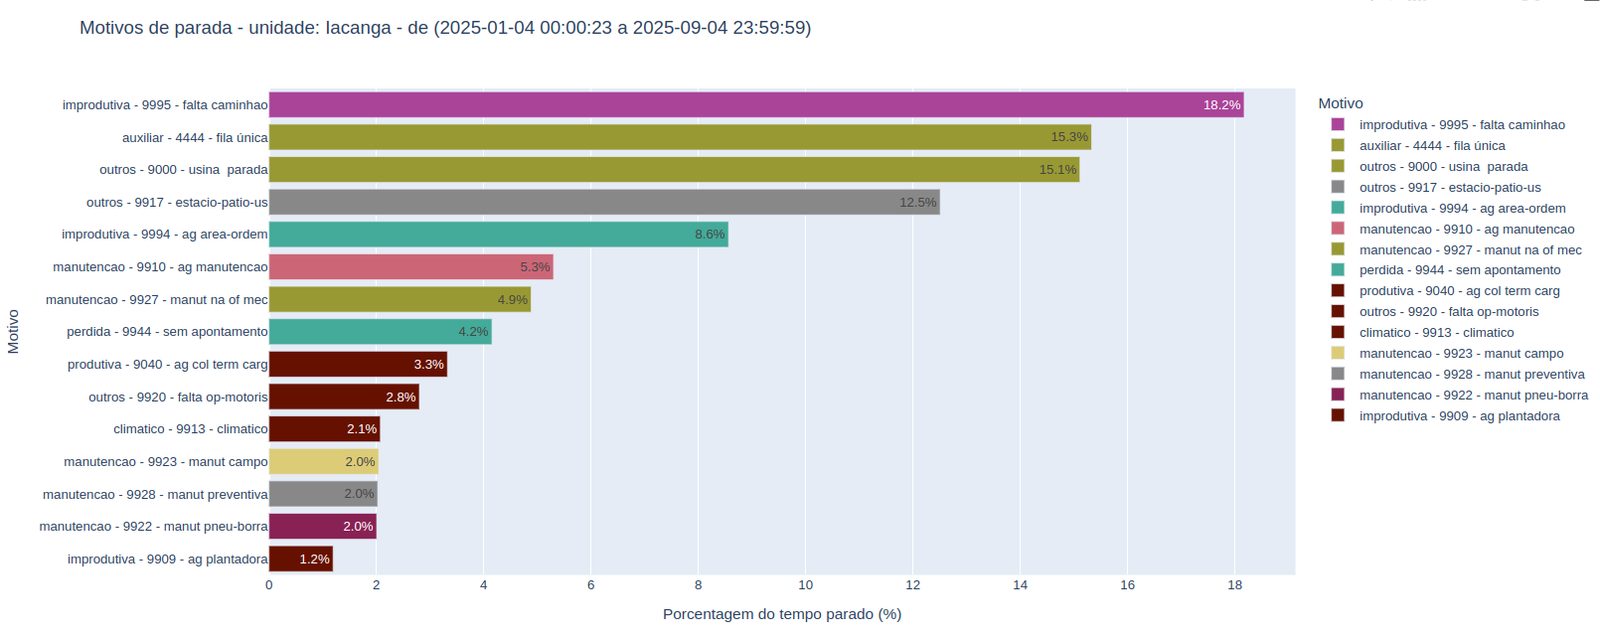
Fig. 12. Iacanga's idle time by reason. Truck shortage leads. 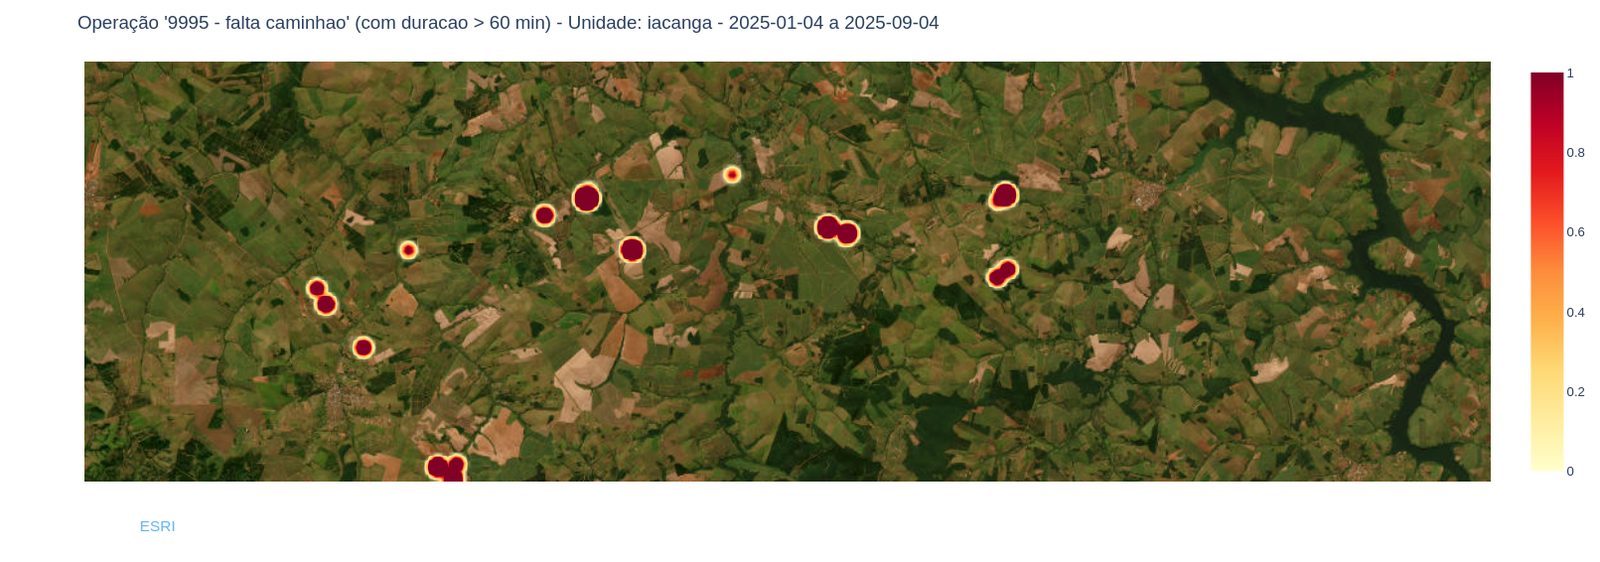
Fig. 13. Every "no truck" minute, geolocated. The clusters are field edges where the convoy stalled, repeatedly, in nine days. - 05
Speed zones
Empty and loaded transbordo speeds were mapped along the haul routes. Slow segments on the empty return leg are the ones a dispatcher can plan around.
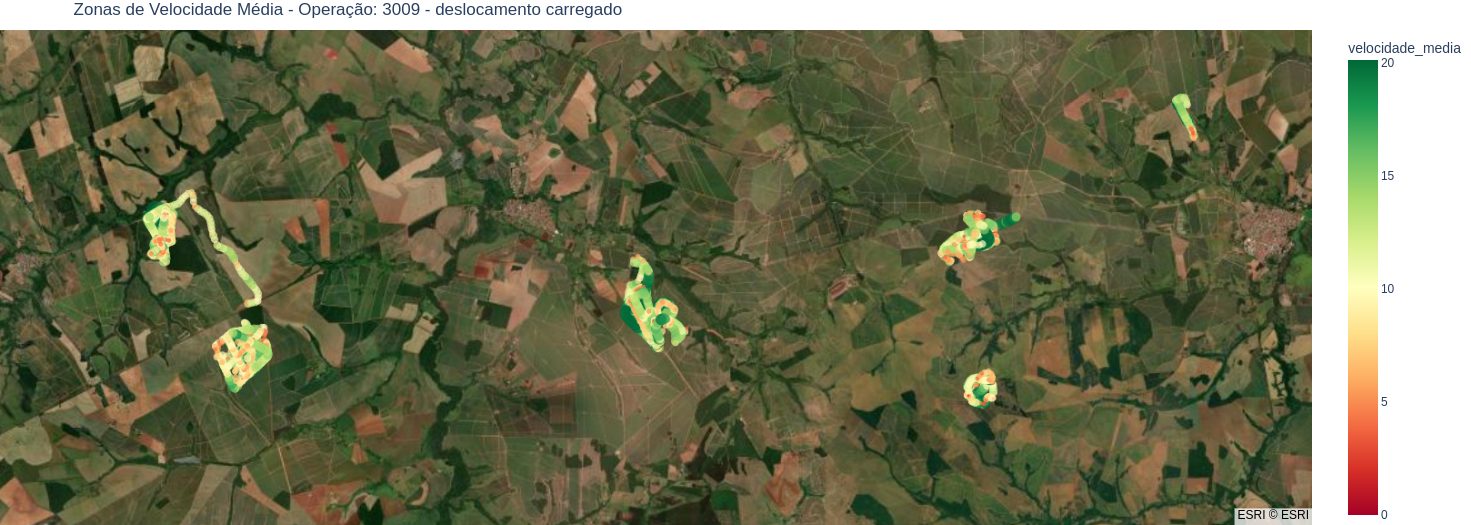
Fig. 14. Average speed of loaded transbordos on the way out. The route is the same every day; the slow stretches are structural. 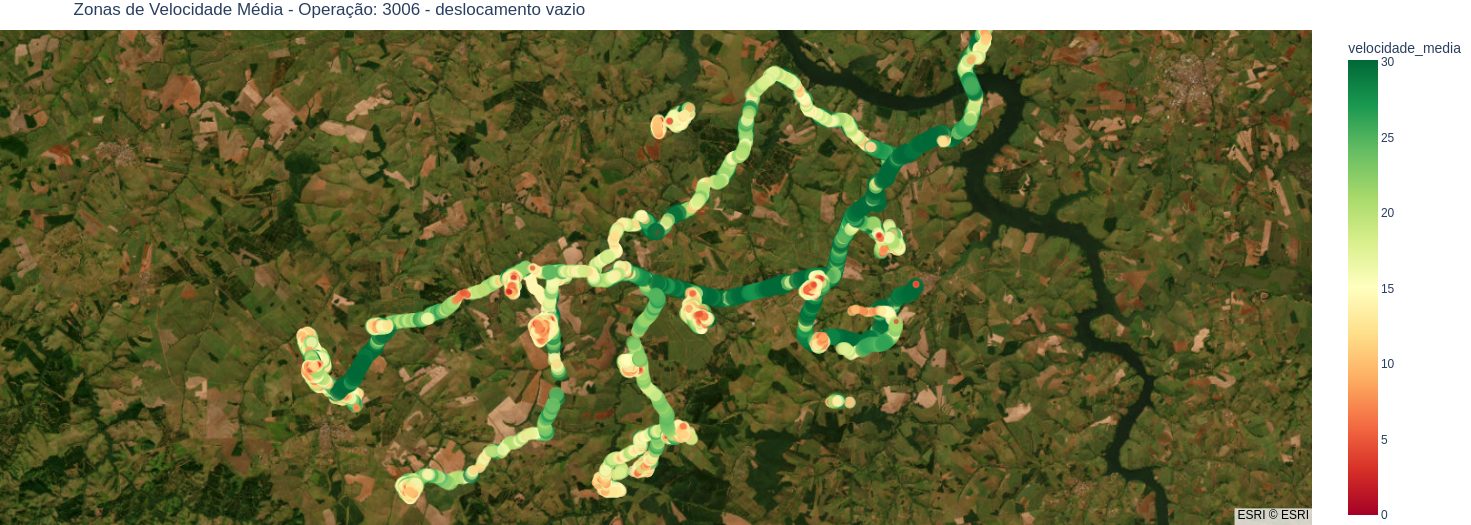
Fig. 15. Speed zones for empty transbordos. Combined with distance to the mill and weather, this is the input a dispatch model needs to time the truck.
Hours of productive transbordo time lost to truck shortage in the period: Mococa 3,068 h, Iacanga 3,618 h.
Assume an intelligent dispatch routine solves only 10% of those truck-shortage stops:
- ~668.6 productive transbordo hours recovered per day across the two units
- 1 productive transbordo hour converted, on average, to 0.54 t of cane at the mill gate
- Over a 240-day harvest: ~86,650 t of additional cane
- At R$ 144.38/t (latest available quote at the time): ~R$ 12.5 million per season
The dispatch model itself was scoped, not built: with historical truck telemetry, the same data can estimate the best moment to release a truck so the transbordo waits as little as possible, using slow-zone maps, equipment-specific speeds, distance to the mill, and weather.
- Telemetry treated as a dataset, not a dashboard: one row per minute, one state per row, aggregated by day, unit, and reason
- Reasons attributed in hours, so the ranking reflects money rather than event counts
- The per-mill split, which turned one average into four different operational conversations
- A conservative economic model (10% resolution rate, published cane price) the finance team could stand behind