Most of what is written about drone agronomy assumes a multispectral sensor: near-infrared, red edge, sometimes SWIR. Corteva's plot was flown with an RGB camera and a thermal camera.
- Client
- Corteva Agriscience (Brazil) - research and trial-plot team
- Industry
- Agriculture · Seed and crop protection R&D
- Problem
- Trial plots were flown with an RGB + thermal drone, no multispectral payload; the team needed quantitative vegetation and stress metrics from what they already had
- Solution
- RGB and thermal orthomosaic generation, five RGB-only vegetation indices, a pixel-level vegetation cover estimate, and a heuristic relative thermal stress index (CWSI*) combining vigor and temperature, with a roadmap for multispectral expansion
- Stack
- Drone RGB + thermal capture · orthomosaic stitching · VARI / ExG / CIVE / TGI / GLI · vegetation segmentation · relative temperature normalization · CWSI* = 1 − VARI × (1 − T_rel)
- Delivered
- July 2025
Most of what is written about drone agronomy assumes a multispectral sensor: near-infrared, red edge, sometimes SWIR. Corteva's plot was flown with an RGB camera and a thermal camera. Every standard index (NDVI, NDRE, NDMI) was off the table.
The question was whether a visible-light-plus-heat capture could still produce a defensible cover number and a stress map for a trial plot, and what would be gained by adding bands later.
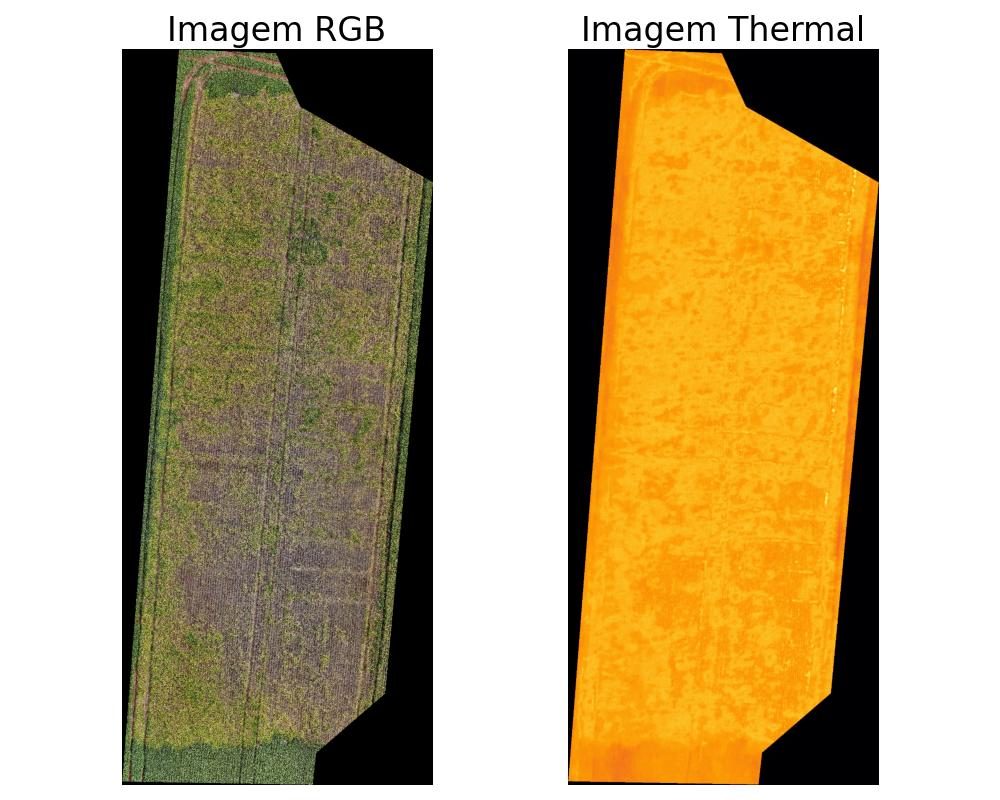
- Orthomosaics from both sensors, aligned
- Vegetation indices computable from RGB alone, with an honest note on what each one is sensitive to
- A vegetation cover estimate in square meters
- A stress map that used the thermal band for something more than a pretty picture
- A clear statement of what NIR, red edge and SWIR would add, to justify the next sensor
- Aligned RGB and thermal orthomosaics of the full plot
- Five RGB indices rendered and documented
- Cover estimated at pixel level (result: 3,140.71 m² of 7,239.59 m²)
- A relative thermal stress index classified into four levels
- 01
Indices from three bands
With only red, green and blue available, five indices were computed. Each has a known behavior: VARI is the most resistant to atmospheric effects and the closest RGB stand-in for vigor; ExG is simple and effective at separating vegetation from soil; CIVE is sensitive to vegetation and used for color-based classification; TGI approximates chlorophyll; GLI separates soil and vegetation in several agricultural settings.

Fig. 04. The five RGB indices used, with formulas and what each is good for. Constraint declared up front. 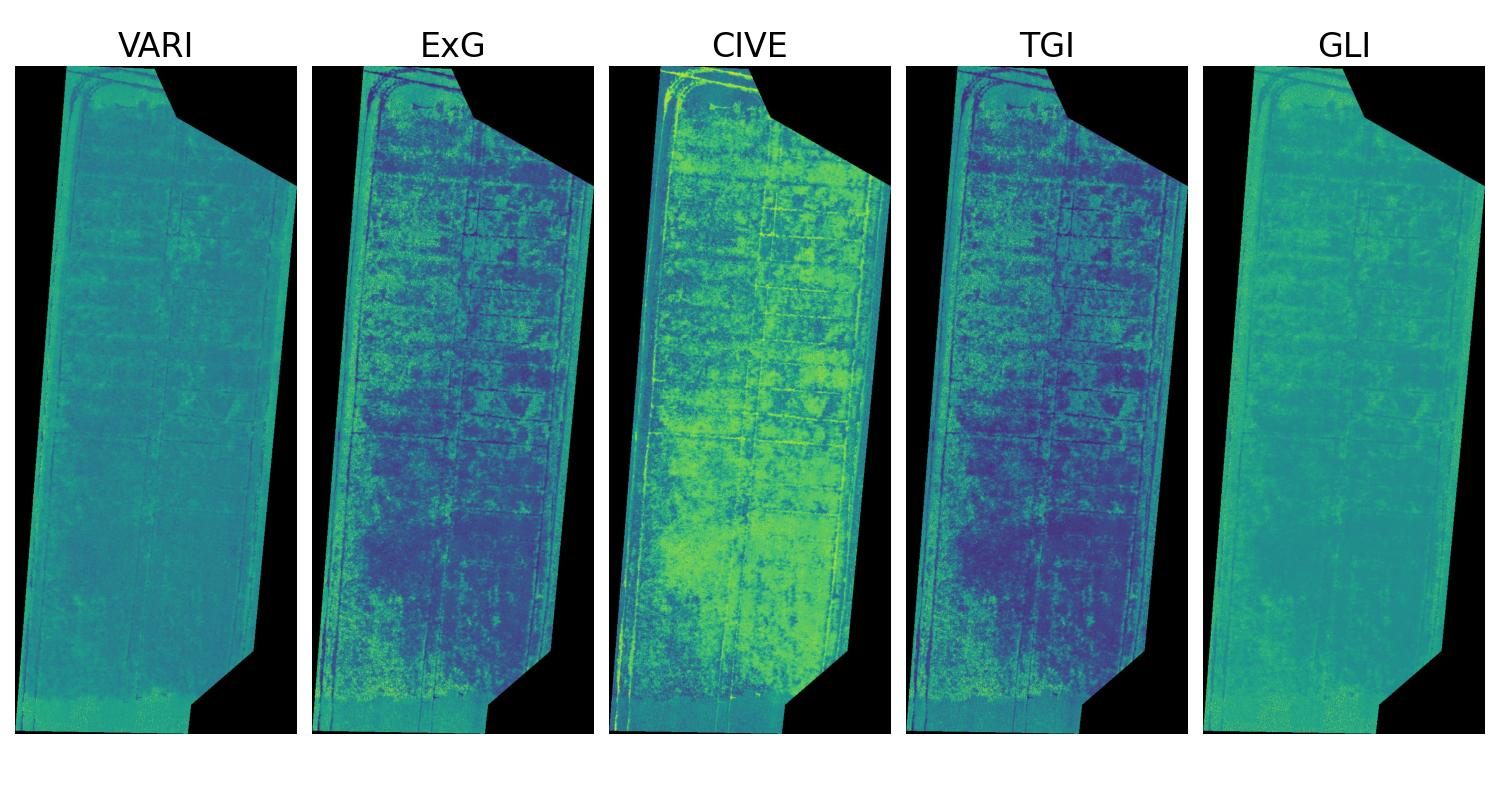
Fig. 05. The same plot through five RGB indices. They agree on the big structure and disagree on the edges, which is the point of running all five. - 02
What the next bands would add
The expansion path was documented alongside the results so the team could size the investment.

Fig. 06. Add near-infrared and NDVI, GNDVI and SAVI become available: biomass, chlorophyll sensitivity, and soil-corrected vigor. 
Fig. 07. Add red edge and stress shows before NDVI saturates: NDRE, chlorophyll index, MCARI. 
Fig. 08. Add SWIR and water content becomes measurable directly: GVMI and NDWI. - 03
Vegetation cover
Vegetation was segmented from the RGB index and counted at pixel level, then converted to area with the orthomosaic's ground sampling distance.
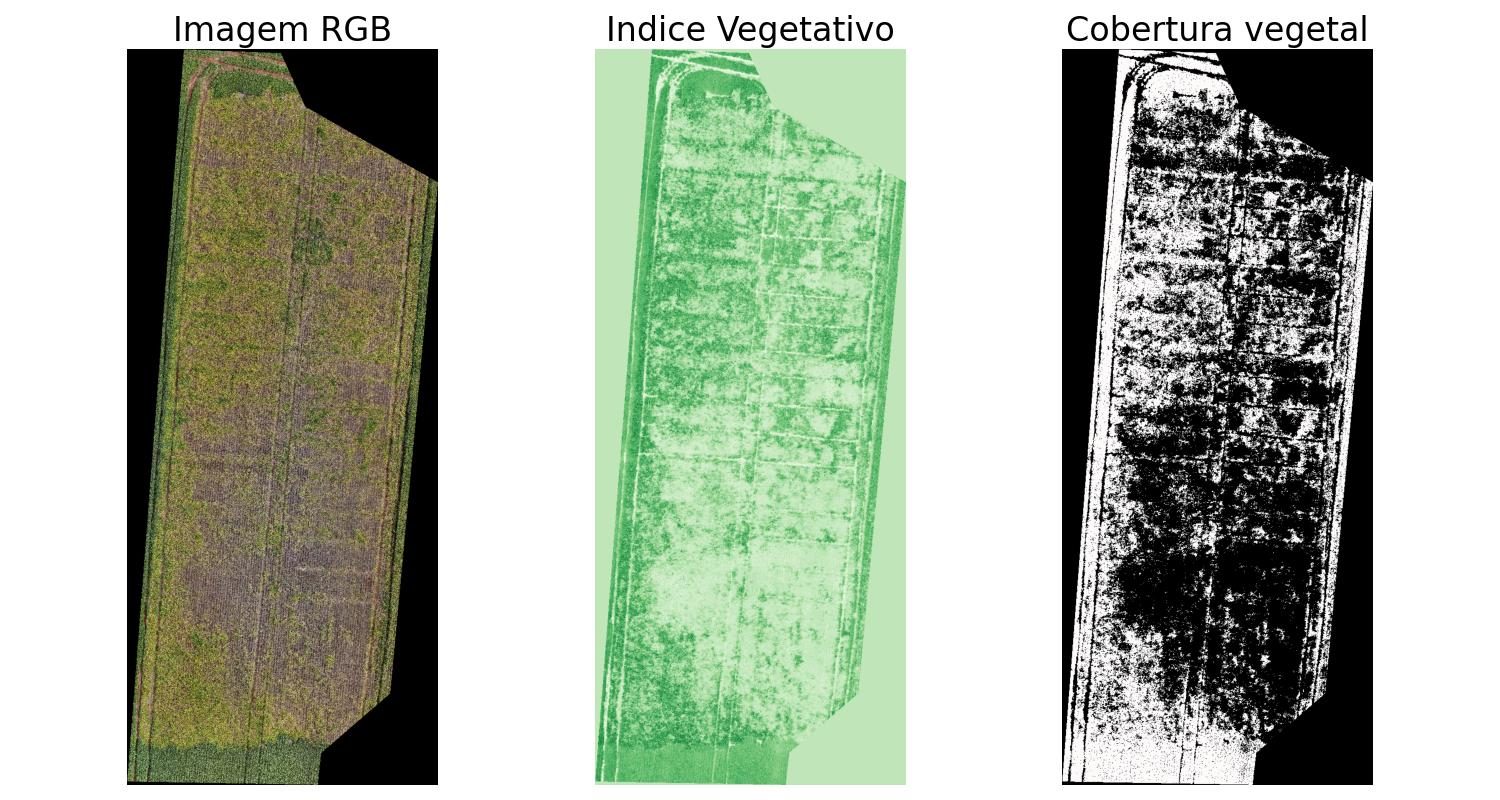
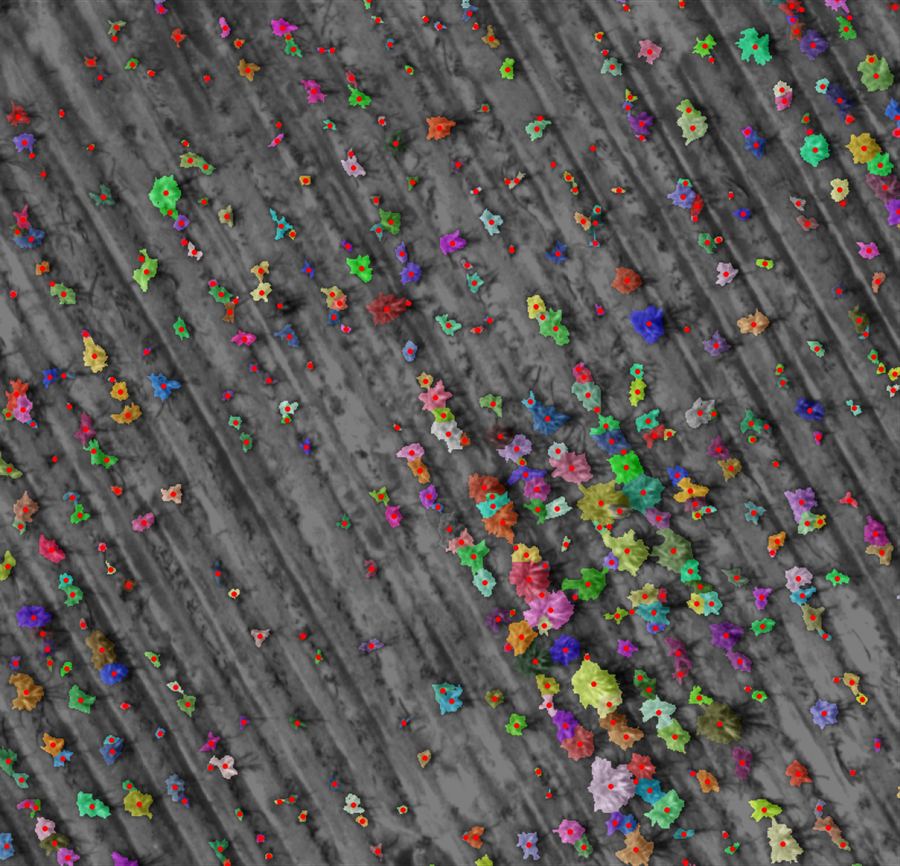
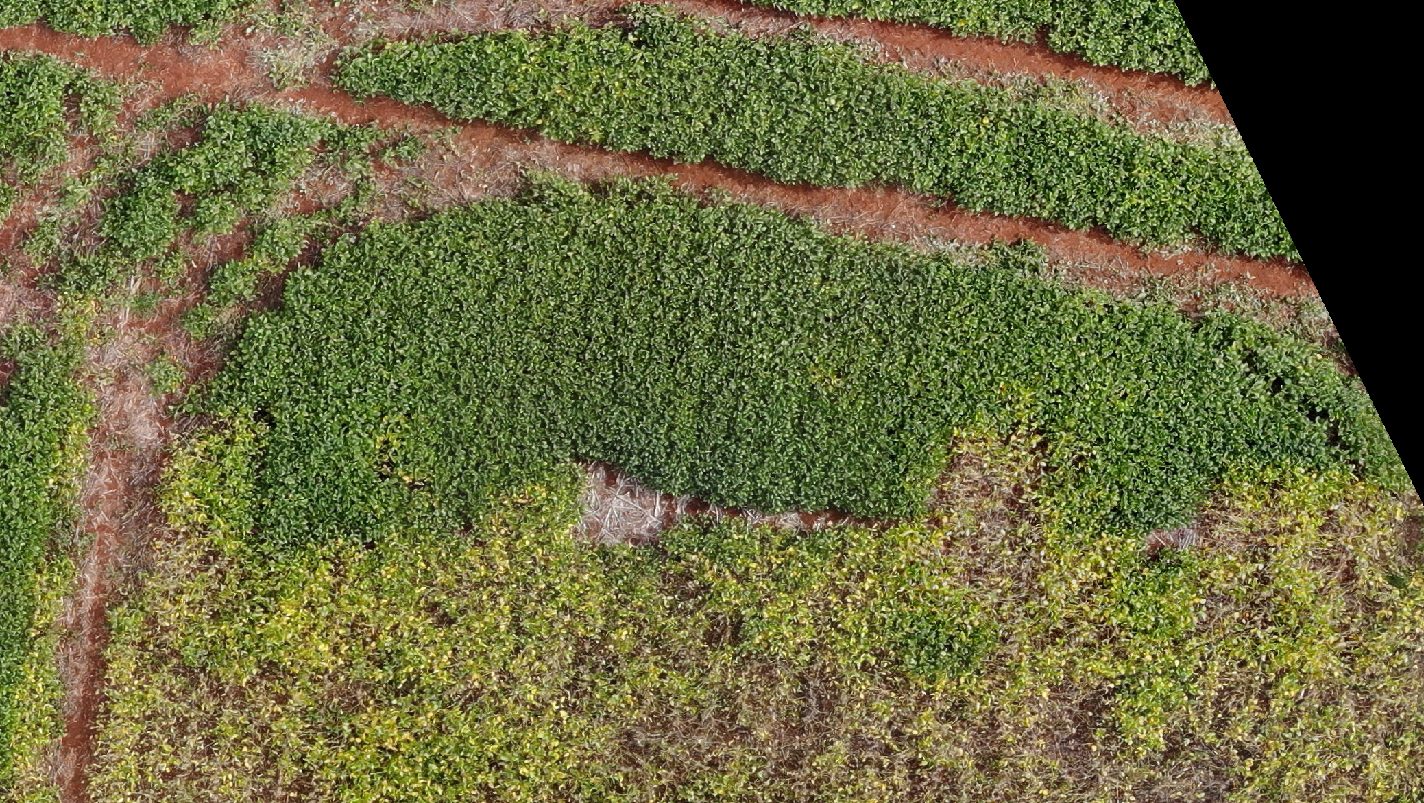
Fig. 09. RGB, index, mask. Estimated vegetation area: 3,140.71 m² of 7,239.59 m² - about 43% cover. 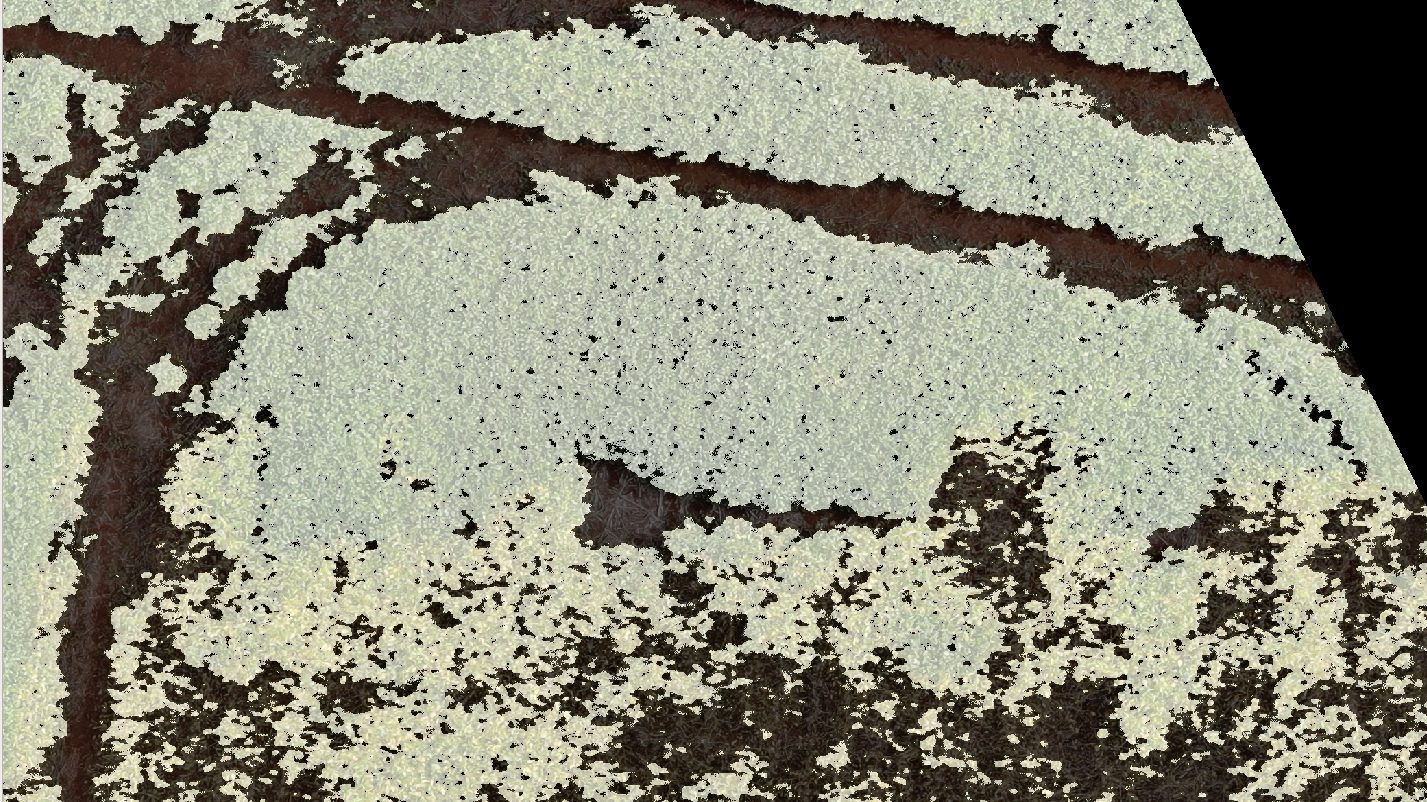
Fig. 10. The mask at full resolution beside the RGB. Gaps inside rows are counted as gaps, not averaged into the canopy. - 04
Relative thermal stress (CWSI*)
A true Crop Water Stress Index needs reference wet and dry surfaces and air temperature. Without them, a heuristic relative index was built that combines two symptoms of the same condition: low vigor (low VARI) and high relative temperature (high T_rel): CWSI* = 1 − VARI × (1 − T_rel) Both terms are symptoms of hydric or physiological stress; the formula combines them in a compensated way so that a hot but vigorous pixel and a cool but sparse pixel do not both read as stressed. The output was classified into four bands: extreme stress, high stress, moderate, and low stress / healthy.
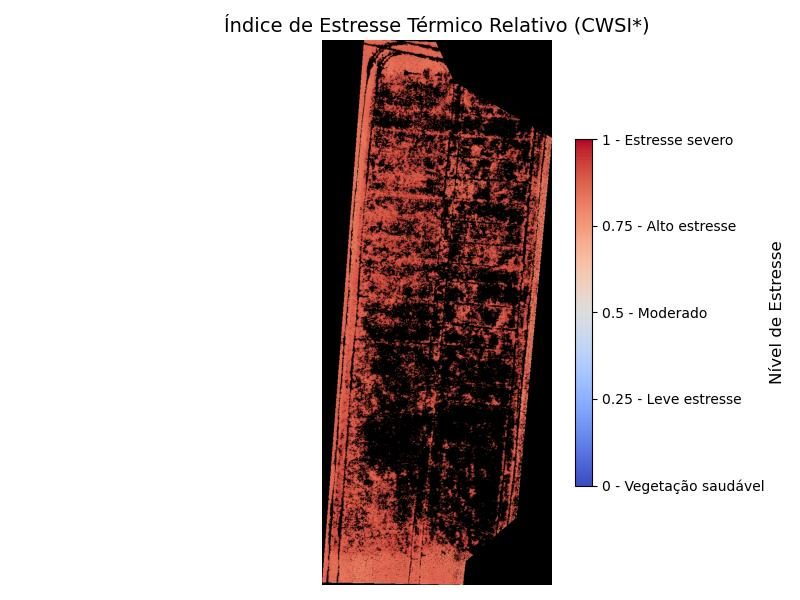
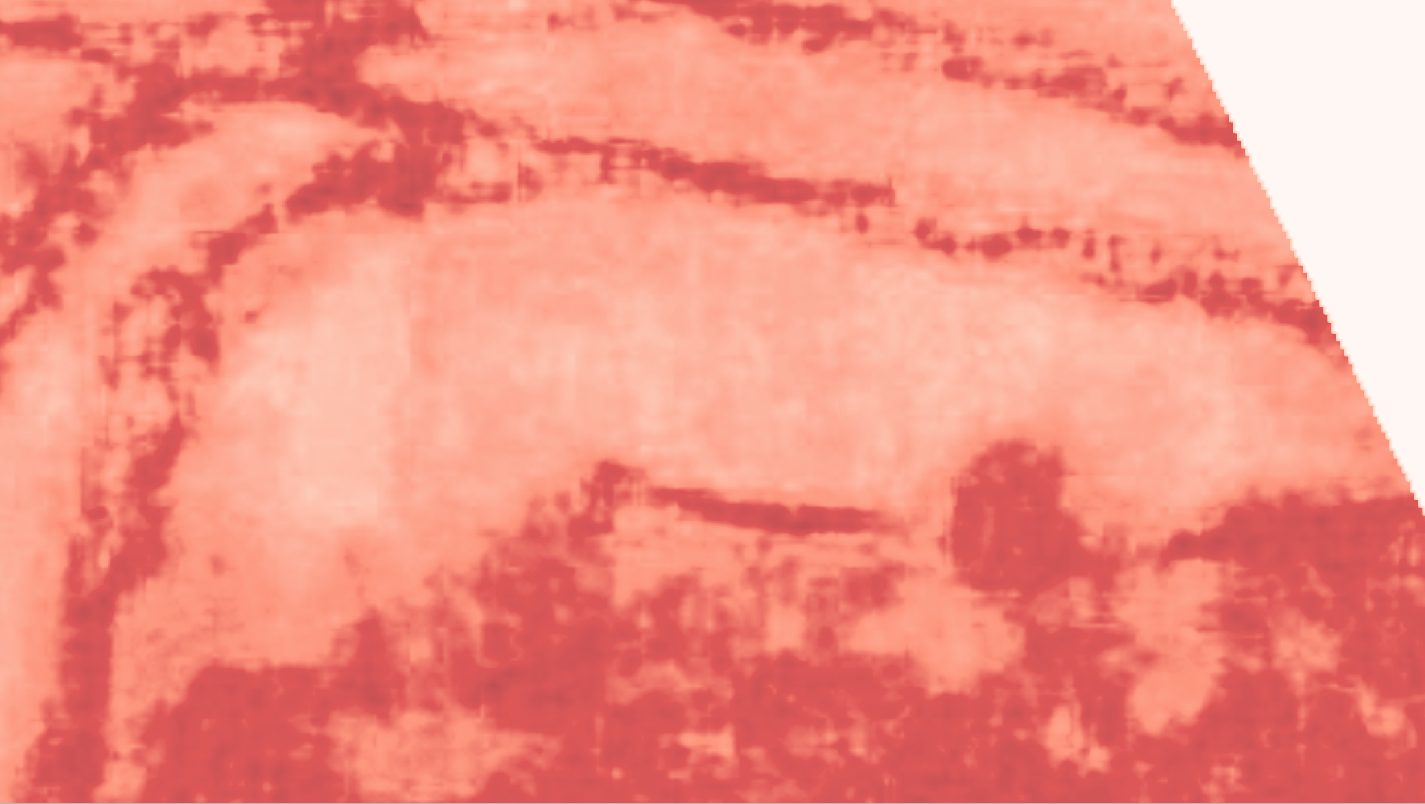
Fig. 11. CWSI* across the plot. Most of the canopy sits in the low-to-moderate band; the hot, low-vigor patches concentrate at the plot boundary and in the bare rows. 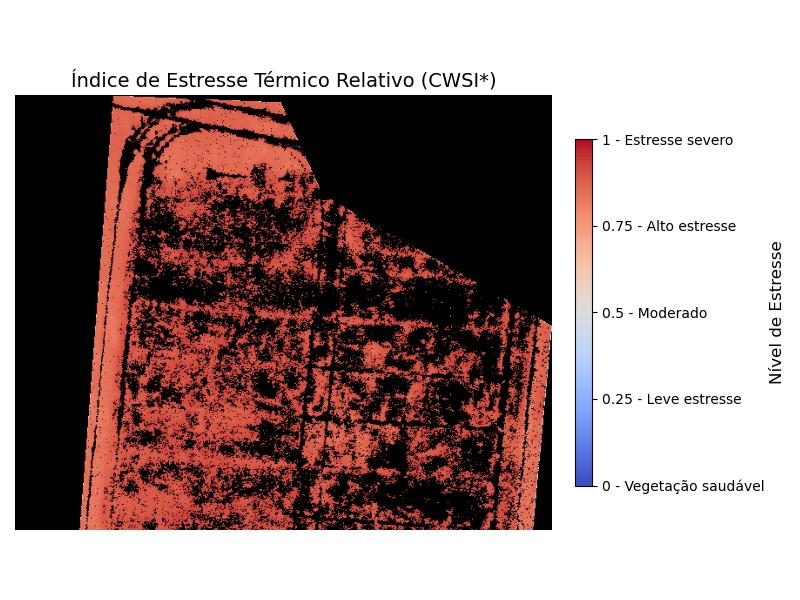
Fig. 12. Closer. The index is explicit about being heuristic; it is a triage map for where to take a porometer, not a substitute for one.
- Working from the sensor the client had, and documenting the ceiling of that sensor
- Five indices instead of one, so agreement between them carries information
- A stress index whose formula fits on one line and can be argued with
- A roadmap for NIR, red edge and SWIR that turned "we need a better drone" into "here is exactly what each band buys"