A language model reading a table does what it does with any text: it pattern-matches. Ask for the average fare difference between men and women on a 891-row dataset and a bare model will produce a number with two decimals and no computation behind it.
- Client
- Turing product line - internal report generation for an agriscience company and for mill groups
- Industry
- Agriculture · Enterprise analytics
- Problem
- Analysts receive raw spreadsheets and are asked for "a report." The model-in-a-chat answer is a paragraph that sounds right and did no arithmetic
- Solution
- A five-agent pipeline that locates the data in a raw sheet, generates the questions worth asking, answers them by writing and executing Python against the dataframe, picks charts, and assembles the report; plus a Human Interaction agent that routes a user's question to a direct answer, to table reasoning, or to a polite "unanswerable"
- Stack
- LLM agents: Column Extraction · Question Generation · Table Reasoning · Chart Definition · Report Generation · Human Interaction (Intention Analysis → Direct Answer / Needs Reasoning → Response Synthesis) · Python function calling over pandas with execution history
- Delivered
- Report generator in the Turing app; Human Interaction agent benchmarked against Gemini (July 2025)
A language model reading a table does what it does with any text: it pattern-matches. Ask for the average fare difference between men and women on a 891-row dataset and a bare model will produce a number with two decimals and no computation behind it. The report that results is fluent and unverifiable.
The requirement was reports whose every figure came from code that ran, on the client's own sheet, with the reasoning trace kept.
- Accept a raw spreadsheet with headers wherever the author left them
- Decide what questions the data can answer
- Compute answers, not describe them
- Choose charts that illustrate the important findings
- Produce a report a manager reads in five minutes
- Handle follow-up questions in conversation without losing rigor
- End-to-end report from an unstructured sheet with no manual column mapping
- Every numeric claim produced by executed code
- Correct answers on reasoning questions where a general model fails
- Graceful refusal when the data cannot answer
- 01
Five agents, one job each
Column Extraction finds where the columns are in the raw sheet. Question Generation proposes relevant questions about the dataframe. Table Reasoning answers each question with Python. Chart Definition picks visuals for the strongest insights. Report Generation assembles it.
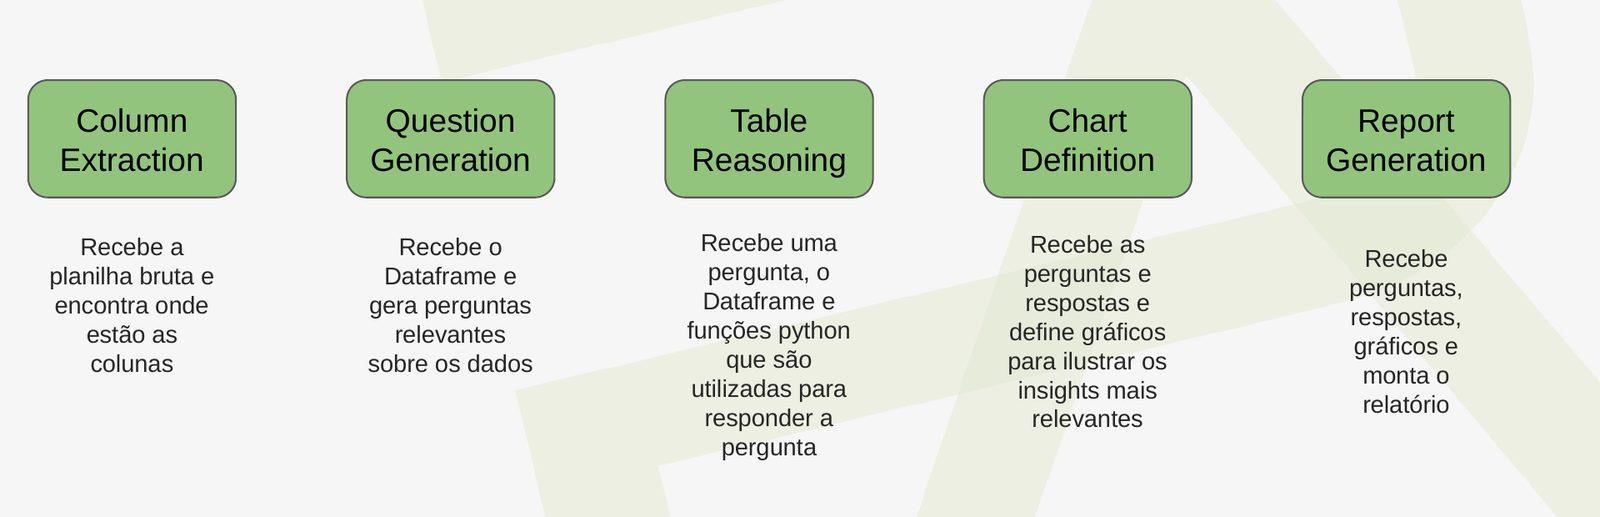
Fig. 02. Column Extraction finds where the columns are in the raw sheet. Question Generation proposes relevant questions about the dataframe. Table Reasoning answers each question with Python. Chart Definition picks visuals for the strongest insights. Report Generation assembles it. - 02
Table Reasoning: the loop that computes
The Table Reasoning agent receives a question, the dataframe, and a set of Python functions. It chooses a function and parameters, the function runs against the table, the result and the call are appended to the history, and the agent decides whether it has enough to answer or needs another step. A public dataset (Titanic, 891 rows × 11 columns) was used to demonstrate the trace end to end.
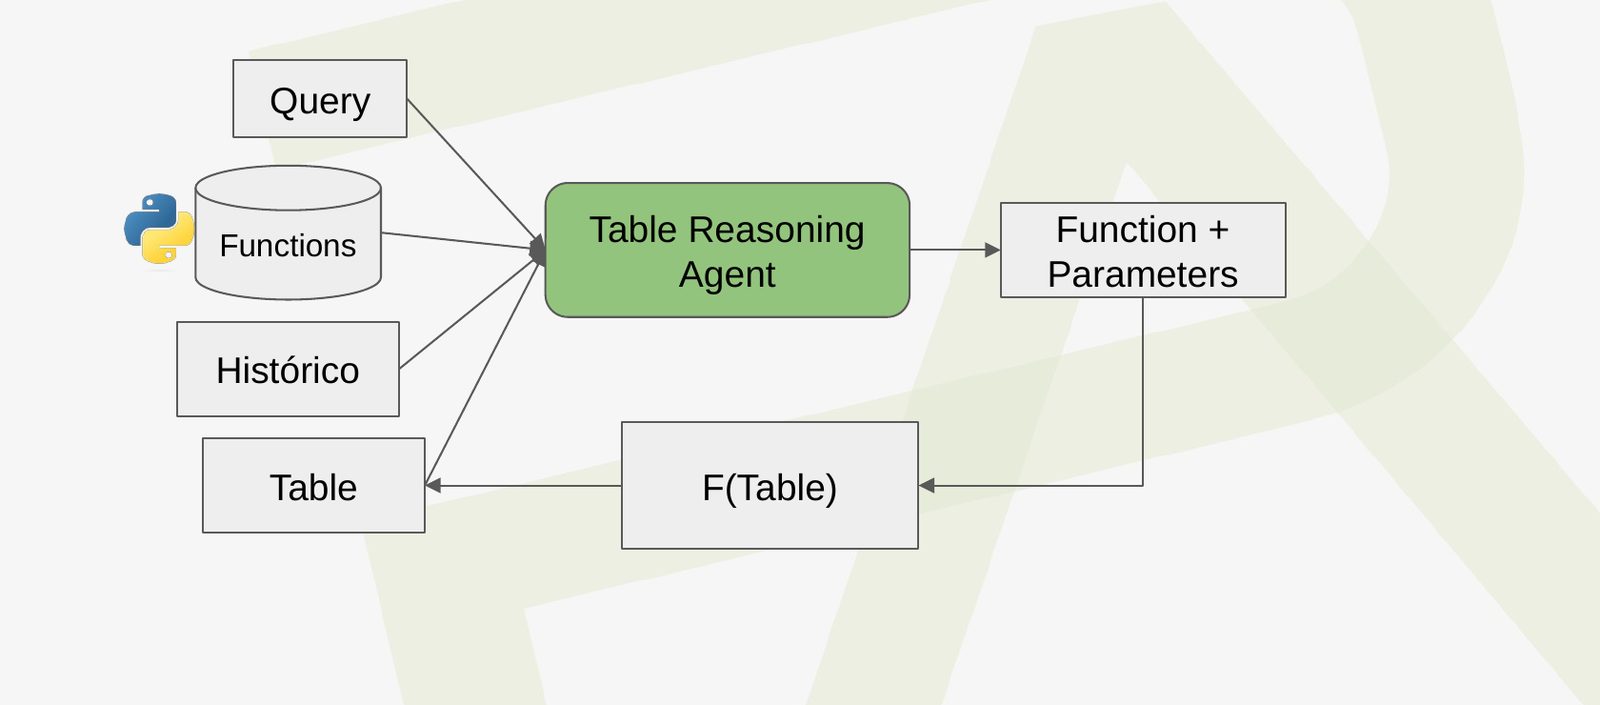
Fig. 03. Query + functions → function + parameters → F(table) → history. The model never sees a number it did not compute. 
Fig. 04. The input. Question: what is the mean fare difference between men and women? 
Fig. 05. Step one: group by sex, mean of fare. 
Fig. 06. Step two: subtract. 
Fig. 07. Step three: state the answer, citing the computed value and the steps. 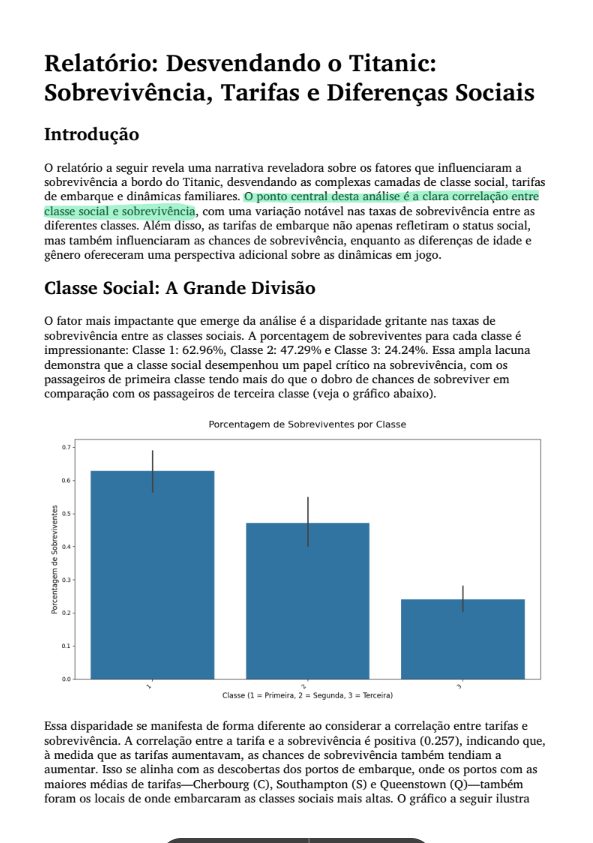
Fig. 08. The assembled report: findings, a chart the Chart Definition agent selected, and prose that only repeats computed numbers. - 03
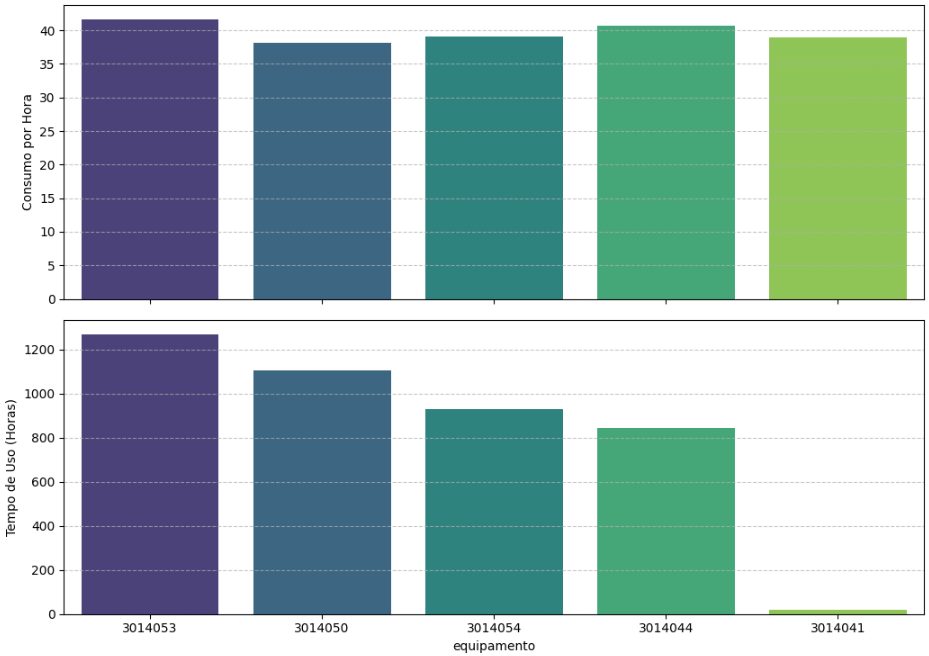
On real agro data
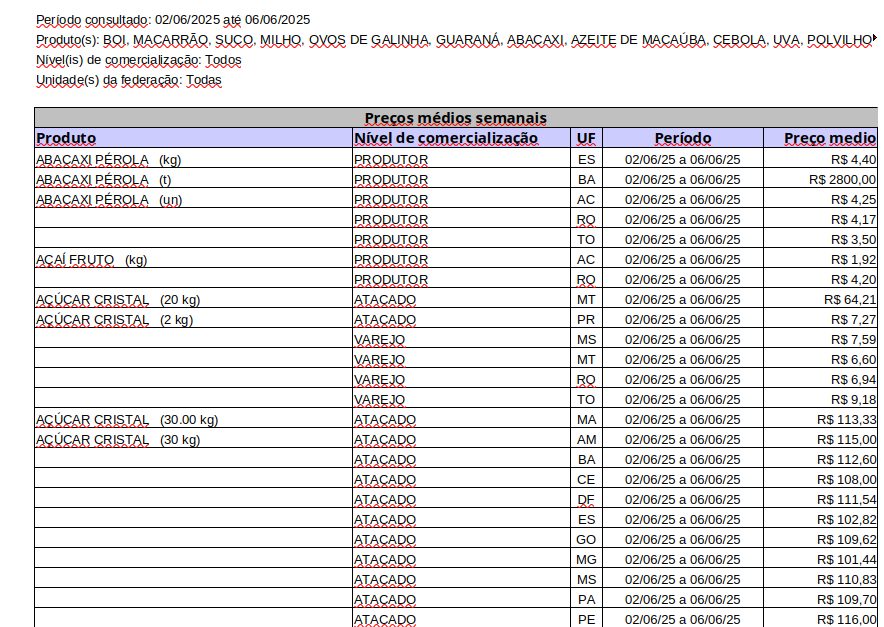
A raw sector spreadsheet, headers not on row one. Column Extraction handles this before anything else runs.
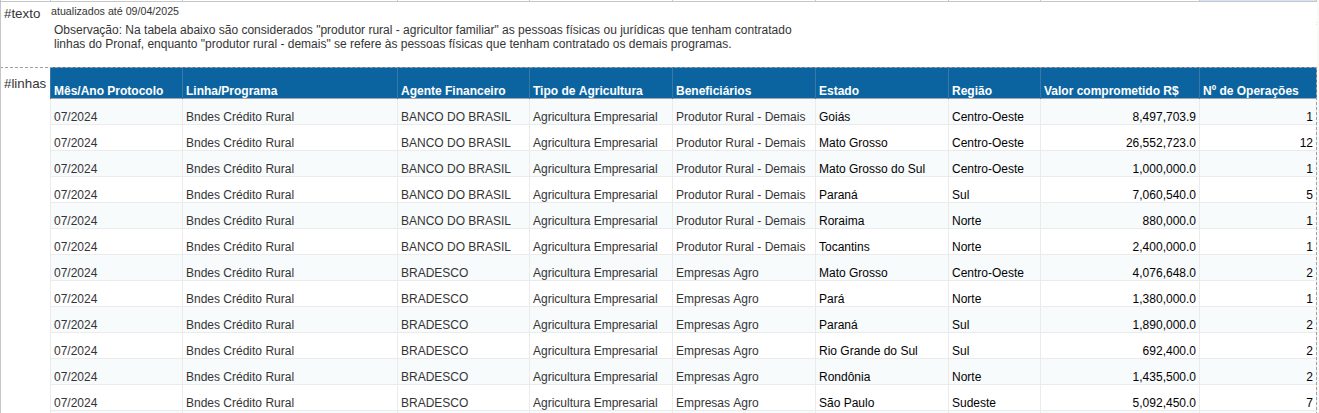
Fig. 09. A raw sector spreadsheet, headers not on row one. Column Extraction handles this before anything else runs. 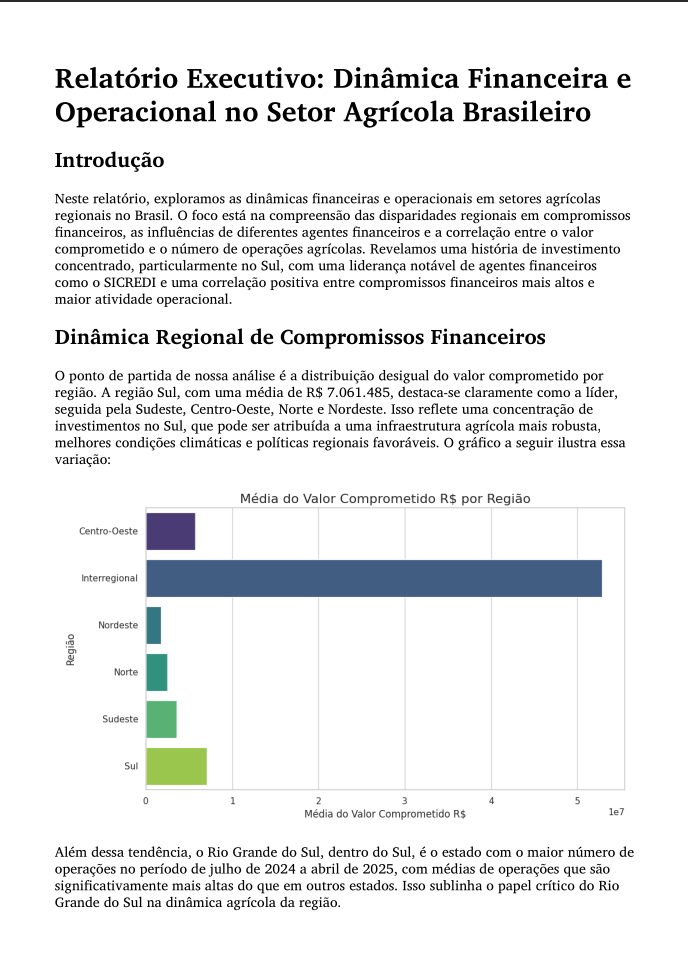
Fig. 10. The executive report generated from it. - 04
Human Interaction agent: routing the question
Reports are one shot; users ask follow-ups. The Human Interaction agent analyses intention first, then routes: a direct answer if the question needs none of the table, table reasoning if it does, or "unanswerable" if the data cannot support it. Response Synthesis turns whichever path was taken into a human-friendly reply.
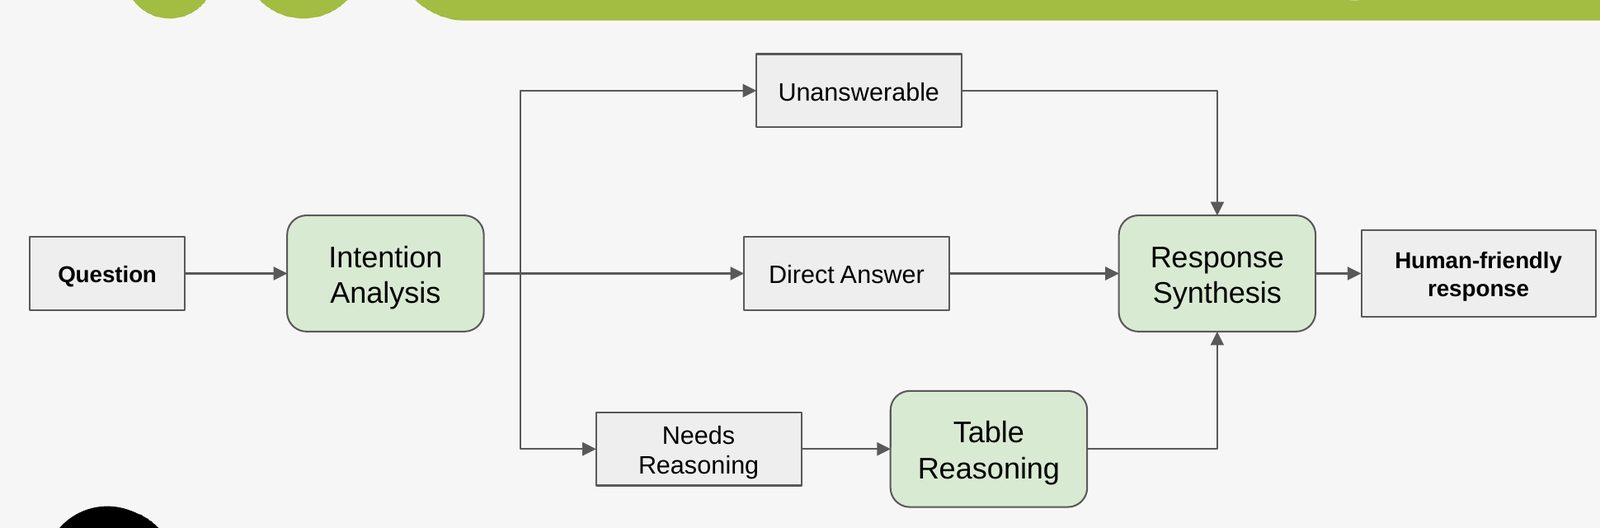
Fig. 11. Three exits from one question. The "unanswerable" branch is a feature: the agent says so instead of inventing. 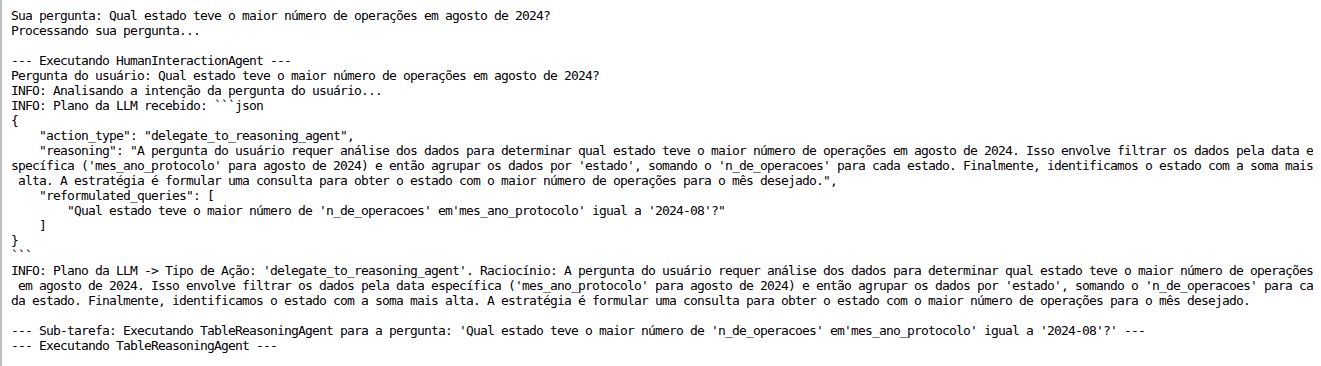
Fig. 12. A question that needs no computation gets a direct answer, without a detour through the table. 
Fig. 13. Benchmark question, asked of both systems. 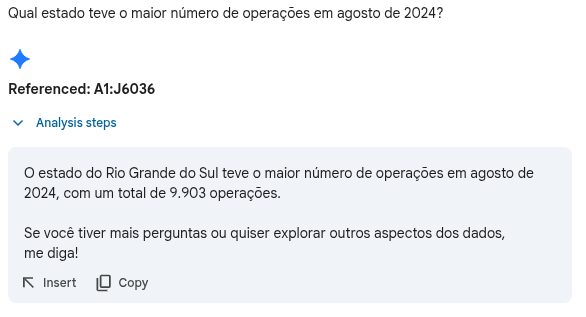
Fig. 14. Gemini's reply: a paraphrase of the columns, no computed result. 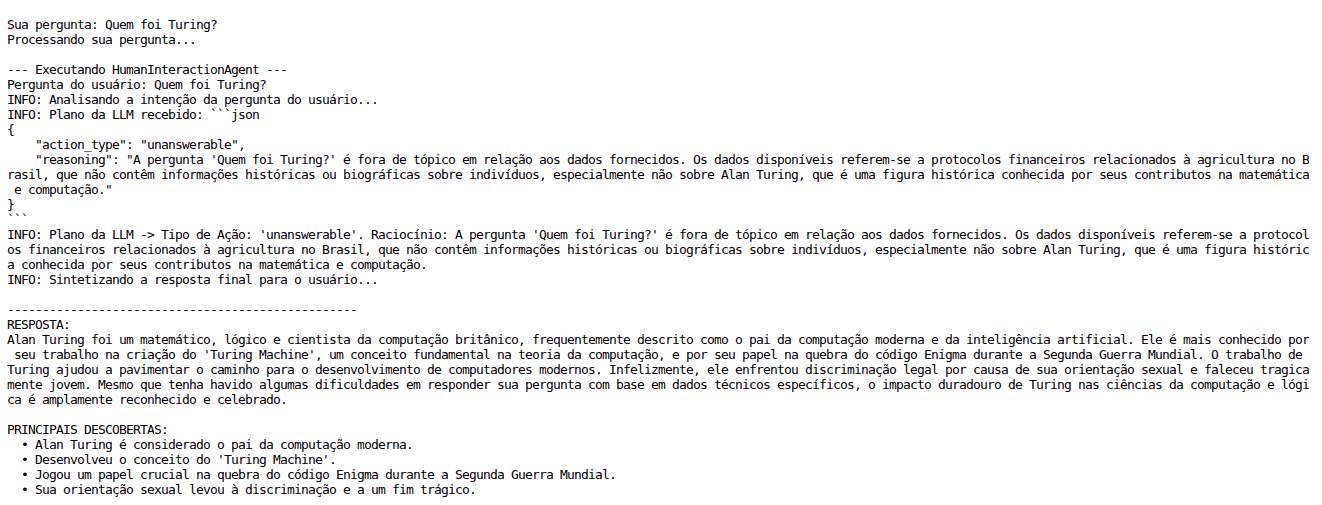
Fig. 15. The Turing agent's trace on a multi-step question: intention, the reasoning route, the executed steps. 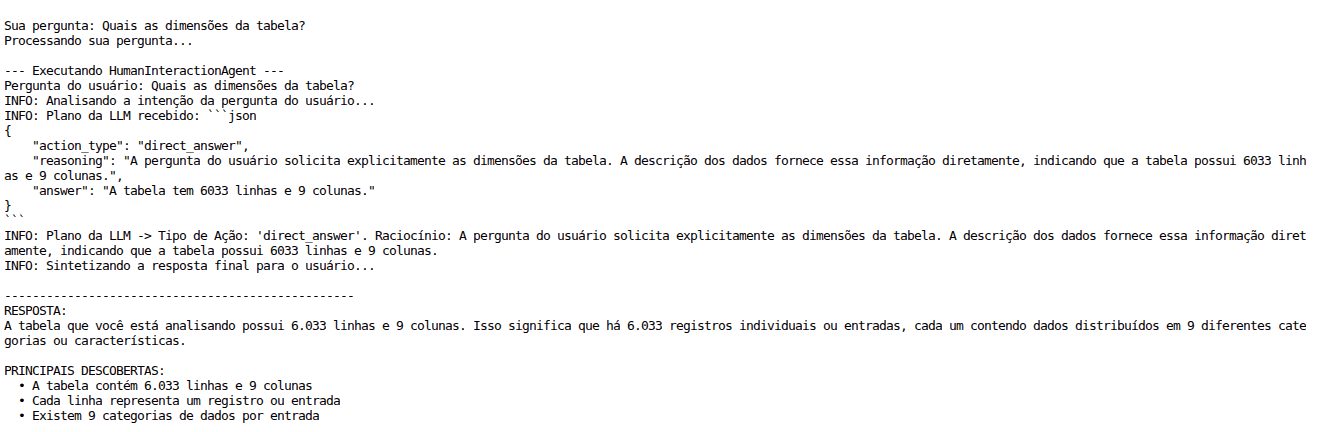
Fig. 16. The synthesized answer, with the computed values it is built from.
- One agent per responsibility, so a wrong column guess and a wrong calculation are different failures with different fixes
- Function calling over the dataframe, with history, so every number in the report was executed
- Question generation as its own step: the report is only as good as the questions
- An explicit "unanswerable" route, which is what keeps the conversational layer honest